Swiss vs Brazilian Receiving Food Stamps
COMPARE
Swiss
Brazilian
Receiving Food Stamps
Receiving Food Stamps Comparison
Swiss
Brazilians
9.7%
RECEIVING FOOD STAMPS
99.3/ 100
METRIC RATING
54th/ 347
METRIC RANK
11.1%
RECEIVING FOOD STAMPS
83.2/ 100
METRIC RATING
149th/ 347
METRIC RANK
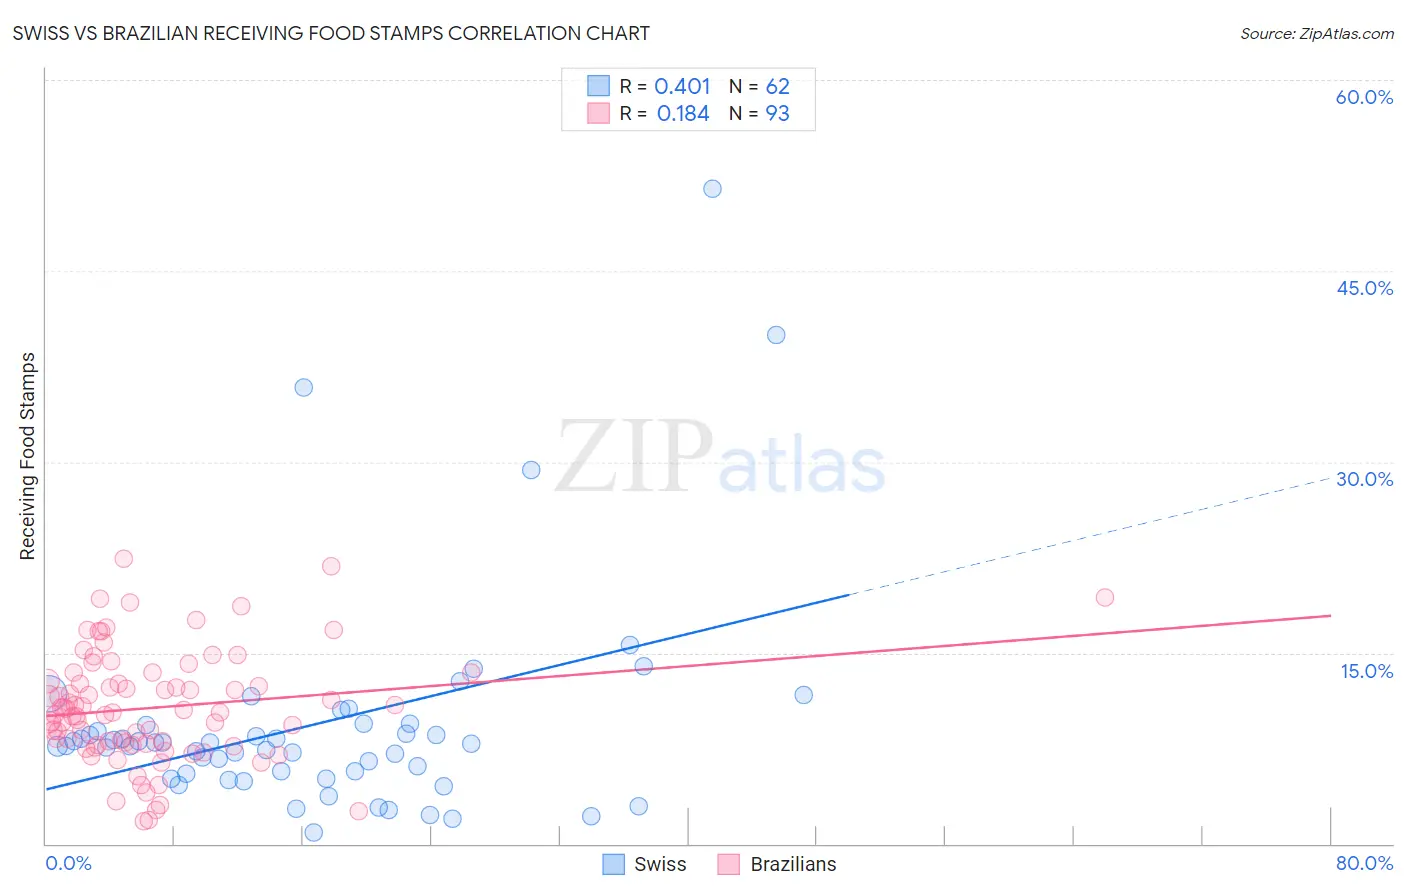
Swiss vs Brazilian Receiving Food Stamps Correlation Chart
The statistical analysis conducted on geographies consisting of 463,160,443 people shows a moderate positive correlation between the proportion of Swiss and percentage of population receiving government assistance and/or food stamps in the United States with a correlation coefficient (R) of 0.401 and weighted average of 9.7%. Similarly, the statistical analysis conducted on geographies consisting of 322,932,120 people shows a poor positive correlation between the proportion of Brazilians and percentage of population receiving government assistance and/or food stamps in the United States with a correlation coefficient (R) of 0.184 and weighted average of 11.1%, a difference of 14.2%.
Receiving Food Stamps Correlation Summary
| Measurement | Swiss | Brazilian |
| Minimum | 0.90% | 1.8% |
| Maximum | 51.5% | 22.4% |
| Range | 50.6% | 20.6% |
| Mean | 9.4% | 10.7% |
| Median | 7.8% | 10.3% |
| Interquartile 25% (IQ1) | 5.5% | 7.8% |
| Interquartile 75% (IQ3) | 9.3% | 13.1% |
| Interquartile Range (IQR) | 3.9% | 5.3% |
| Standard Deviation (Sample) | 8.7% | 4.4% |
| Standard Deviation (Population) | 8.6% | 4.3% |
Similar Demographics by Receiving Food Stamps
Demographics Similar to Swiss by Receiving Food Stamps
In terms of receiving food stamps, the demographic groups most similar to Swiss are Immigrants from Switzerland (9.7%, a difference of 0.010%), Tongan (9.7%, a difference of 0.12%), Immigrants from South Africa (9.7%, a difference of 0.13%), Asian (9.7%, a difference of 0.15%), and Immigrants from Canada (9.7%, a difference of 0.19%).
| Demographics | Rating | Rank | Receiving Food Stamps |
| Indians (Asian) | 99.4 /100 | #47 | Exceptional 9.6% |
| Russians | 99.4 /100 | #48 | Exceptional 9.6% |
| Immigrants | Czechoslovakia | 99.4 /100 | #49 | Exceptional 9.6% |
| Lithuanians | 99.4 /100 | #50 | Exceptional 9.7% |
| Asians | 99.3 /100 | #51 | Exceptional 9.7% |
| Immigrants | South Africa | 99.3 /100 | #52 | Exceptional 9.7% |
| Tongans | 99.3 /100 | #53 | Exceptional 9.7% |
| Swiss | 99.3 /100 | #54 | Exceptional 9.7% |
| Immigrants | Switzerland | 99.3 /100 | #55 | Exceptional 9.7% |
| Immigrants | Canada | 99.3 /100 | #56 | Exceptional 9.7% |
| Greeks | 99.3 /100 | #57 | Exceptional 9.7% |
| Scandinavians | 99.2 /100 | #58 | Exceptional 9.7% |
| British | 99.2 /100 | #59 | Exceptional 9.7% |
| Germans | 99.2 /100 | #60 | Exceptional 9.7% |
| English | 99.2 /100 | #61 | Exceptional 9.8% |
Demographics Similar to Brazilians by Receiving Food Stamps
In terms of receiving food stamps, the demographic groups most similar to Brazilians are Immigrants from South Eastern Asia (11.1%, a difference of 0.020%), Soviet Union (11.1%, a difference of 0.020%), White/Caucasian (11.1%, a difference of 0.18%), Taiwanese (11.0%, a difference of 0.28%), and Immigrants from Spain (11.1%, a difference of 0.38%).
| Demographics | Rating | Rank | Receiving Food Stamps |
| Chileans | 86.2 /100 | #142 | Excellent 11.0% |
| Immigrants | Northern Africa | 86.0 /100 | #143 | Excellent 11.0% |
| Syrians | 85.5 /100 | #144 | Excellent 11.0% |
| Hungarians | 85.1 /100 | #145 | Excellent 11.0% |
| Taiwanese | 84.2 /100 | #146 | Excellent 11.0% |
| Whites/Caucasians | 83.9 /100 | #147 | Excellent 11.1% |
| Immigrants | South Eastern Asia | 83.3 /100 | #148 | Excellent 11.1% |
| Brazilians | 83.2 /100 | #149 | Excellent 11.1% |
| Soviet Union | 83.1 /100 | #150 | Excellent 11.1% |
| Immigrants | Spain | 81.7 /100 | #151 | Excellent 11.1% |
| Immigrants | Kazakhstan | 81.7 /100 | #152 | Excellent 11.1% |
| Lebanese | 81.6 /100 | #153 | Excellent 11.1% |
| Armenians | 81.4 /100 | #154 | Excellent 11.1% |
| Immigrants | Argentina | 80.4 /100 | #155 | Excellent 11.2% |
| Immigrants | Afghanistan | 75.6 /100 | #156 | Good 11.3% |