Swedish vs Ethiopian Child Poverty Under the Age of 16

COMPARE

Swedish
Race
Ancestry
AfghanAfricanAlaska NativeAlaskan AthabascanAlbanianAleutAlsatianAmericanApacheArabArapahoArgentineanArmenianAssyrian/Chaldean/SyriacAustralianAustrianBahamianBangladeshiBarbadianBasqueBelgianBelizeanBermudanBhutaneseBlackfeetBolivianBrazilianBritishBritish West IndianBulgarianBurmeseCajunCambodianCanadianCape VerdeanCarpatho RusynCelticCentral AmericanCentral American IndianCherokeeCheyenneChickasawChileanChineseChippewaChoctawColombianColvilleComancheCosta RicanCreeCreekCroatianCrowCubanCypriotCzechCzechoslovakianDanishDelawareDominicanDutchDutch West IndianEastern EuropeanEcuadorianEgyptianEnglishEstonianEuropeanFijianFilipinoFinnishFrenchFrench American IndianFrench CanadianGermanGerman RussianGhanaianGreekGuamanian/ChamorroGuatemalanGuyaneseHaitianHmongHonduranHopiHoumaHungarianIcelanderIndian (Asian)IndonesianInupiatIranianIraqiIrishIroquoisIsraeliItalianJamaicanJapaneseJordanianKenyanKiowaKoreanLaotianLatvianLebaneseLiberianLithuanianLumbeeLuxembourgerMacedonianMalaysianMalteseMarshalleseMenomineeMexicanMexican American IndianMongolianMoroccanNative HawaiianNavajoNepaleseNew ZealanderNicaraguanNigerianNorthern EuropeanNorwegianOkinawanOsageOttawaPaiutePakistaniPalestinianPanamanianParaguayanPennsylvania GermanPeruvianPimaPolishPortuguesePotawatomiPuebloPuerto RicanPuget Sound SalishRomanianRussianSalvadoranSamoanScandinavianScotch-IrishScottishSeminoleSenegaleseSerbianShoshoneSierra LeoneanSiouxSlavicSlovakSloveneSomaliSouth AfricanSouth AmericanSouth American IndianSoviet UnionSpaniardSpanishSpanish AmericanSpanish American IndianSri LankanSubsaharan AfricanSudaneseSwedishSwissSyrianTaiwaneseThaiTlingit-HaidaTohono O'OdhamTonganTrinidadian and TobagonianTsimshianTurkishU.S. Virgin IslanderUgandanUkrainianUruguayanUteVenezuelanVietnameseWelshWest IndianYakamaYaquiYugoslavianYumanYup'ikZimbabwean
Immigration
NonimmigrantsImmigrantsAfghanistanAfricaAlbaniaArgentinaArmeniaAsiaAustraliaAustriaBahamasBangladeshBarbadosBelarusBelgiumBelizeBoliviaBosnia and HerzegovinaBrazilBulgariaBurma/MyanmarCabo VerdeCambodiaCameroonCanadaCaribbeanCentral AmericaChileChinaColombiaCongoCosta RicaCroatiaCubaCzechoslovakiaDenmarkDominicaDominican RepublicEastern AfricaEastern AsiaEastern EuropeEcuadorEgyptEl SalvadorEnglandEritreaEthiopiaEuropeFijiFranceGermanyGhanaGreeceGrenadaGuatemalaGuyanaHaitiHondurasHong KongHungaryIndiaIndonesiaIranIraqIrelandIsraelItalyJamaicaJapanJordanKazakhstanKenyaKoreaKuwaitLaosLatin AmericaLatviaLebanonLiberiaLithuaniaMalaysiaMexicoMicronesiaMiddle AfricaMoldovaMoroccoNepalNetherlandsNicaraguaNigeriaNorth AmericaNorth MacedoniaNorthern AfricaNorthern EuropeNorwayOceaniaPakistanPanamaPeruPhilippinesPolandPortugalRomaniaRussiaSaudi ArabiaScotlandSenegalSerbiaSierra LeoneSingaporeSomaliaSouth AfricaSouth AmericaSouth Central AsiaSouth Eastern AsiaSouthern EuropeSpainSri LankaSt. Vincent and the GrenadinesSudanSwedenSwitzerlandSyriaTaiwanThailandTrinidad and TobagoTurkeyUgandaUkraineUruguayUzbekistanVenezuelaVietnamWest IndiesWestern AfricaWestern AsiaWestern EuropeYemenZaireZimbabweAzores
Ethiopian
Race
Ancestry
AfghanAfricanAlaska NativeAlaskan AthabascanAlbanianAleutAlsatianAmericanApacheArabArapahoArgentineanArmenianAssyrian/Chaldean/SyriacAustralianAustrianBahamianBangladeshiBarbadianBasqueBelgianBelizeanBermudanBhutaneseBlackfeetBolivianBrazilianBritishBritish West IndianBulgarianBurmeseCajunCambodianCanadianCape VerdeanCarpatho RusynCelticCentral AmericanCentral American IndianCherokeeCheyenneChickasawChileanChineseChippewaChoctawColombianColvilleComancheCosta RicanCreeCreekCroatianCrowCubanCypriotCzechCzechoslovakianDanishDelawareDominicanDutchDutch West IndianEastern EuropeanEcuadorianEgyptianEnglishEstonianEthiopianEuropeanFijianFilipinoFinnishFrenchFrench American IndianFrench CanadianGermanGerman RussianGhanaianGreekGuamanian/ChamorroGuatemalanGuyaneseHaitianHmongHonduranHopiHoumaHungarianIcelanderIndian (Asian)IndonesianInupiatIranianIraqiIrishIroquoisIsraeliItalianJamaicanJapaneseJordanianKenyanKiowaKoreanLaotianLatvianLebaneseLiberianLithuanianLumbeeLuxembourgerMacedonianMalaysianMalteseMarshalleseMenomineeMexicanMexican American IndianMongolianMoroccanNative HawaiianNavajoNepaleseNew ZealanderNicaraguanNigerianNorthern EuropeanNorwegianOkinawanOsageOttawaPaiutePakistaniPalestinianPanamanianParaguayanPennsylvania GermanPeruvianPimaPolishPortuguesePotawatomiPuebloPuerto RicanPuget Sound SalishRomanianRussianSalvadoranSamoanScandinavianScotch-IrishScottishSeminoleSenegaleseSerbianShoshoneSierra LeoneanSiouxSlavicSlovakSloveneSomaliSouth AfricanSouth AmericanSouth American IndianSoviet UnionSpaniardSpanishSpanish AmericanSpanish American IndianSri LankanSubsaharan AfricanSudaneseSwissSyrianTaiwaneseThaiTlingit-HaidaTohono O'OdhamTonganTrinidadian and TobagonianTsimshianTurkishU.S. Virgin IslanderUgandanUkrainianUruguayanUteVenezuelanVietnameseWelshWest IndianYakamaYaquiYugoslavianYumanYup'ikZimbabwean
Immigration
NonimmigrantsImmigrantsAfghanistanAfricaAlbaniaArgentinaArmeniaAsiaAustraliaAustriaBahamasBangladeshBarbadosBelarusBelgiumBelizeBoliviaBosnia and HerzegovinaBrazilBulgariaBurma/MyanmarCabo VerdeCambodiaCameroonCanadaCaribbeanCentral AmericaChileChinaColombiaCongoCosta RicaCroatiaCubaCzechoslovakiaDenmarkDominicaDominican RepublicEastern AfricaEastern AsiaEastern EuropeEcuadorEgyptEl SalvadorEnglandEritreaEthiopiaEuropeFijiFranceGermanyGhanaGreeceGrenadaGuatemalaGuyanaHaitiHondurasHong KongHungaryIndiaIndonesiaIranIraqIrelandIsraelItalyJamaicaJapanJordanKazakhstanKenyaKoreaKuwaitLaosLatin AmericaLatviaLebanonLiberiaLithuaniaMalaysiaMexicoMicronesiaMiddle AfricaMoldovaMoroccoNepalNetherlandsNicaraguaNigeriaNorth AmericaNorth MacedoniaNorthern AfricaNorthern EuropeNorwayOceaniaPakistanPanamaPeruPhilippinesPolandPortugalRomaniaRussiaSaudi ArabiaScotlandSenegalSerbiaSierra LeoneSingaporeSomaliaSouth AfricaSouth AmericaSouth Central AsiaSouth Eastern AsiaSouthern EuropeSpainSri LankaSt. Vincent and the GrenadinesSudanSwedenSwitzerlandSyriaTaiwanThailandTrinidad and TobagoTurkeyUgandaUkraineUruguayUzbekistanVenezuelaVietnamWest IndiesWestern AfricaWestern AsiaWestern EuropeYemenZaireZimbabweAzores
Child Poverty Under the Age of 16
Income
Poverty
Unemployment
Labor Participation
Family Structure
Vehicle Availability
Education Level
Disability

Child Poverty Under the Age of 16 Comparison

Swedes

Ethiopians

Exceptional
Average
13.3%
CHILD POVERTY UNDER THE AGE OF 16
99.7/ 100
METRIC RATING
29th/ 347
METRIC RANK
16.3%
CHILD POVERTY UNDER THE AGE OF 16
43.4/ 100
METRIC RATING
177th/ 347
METRIC RANK

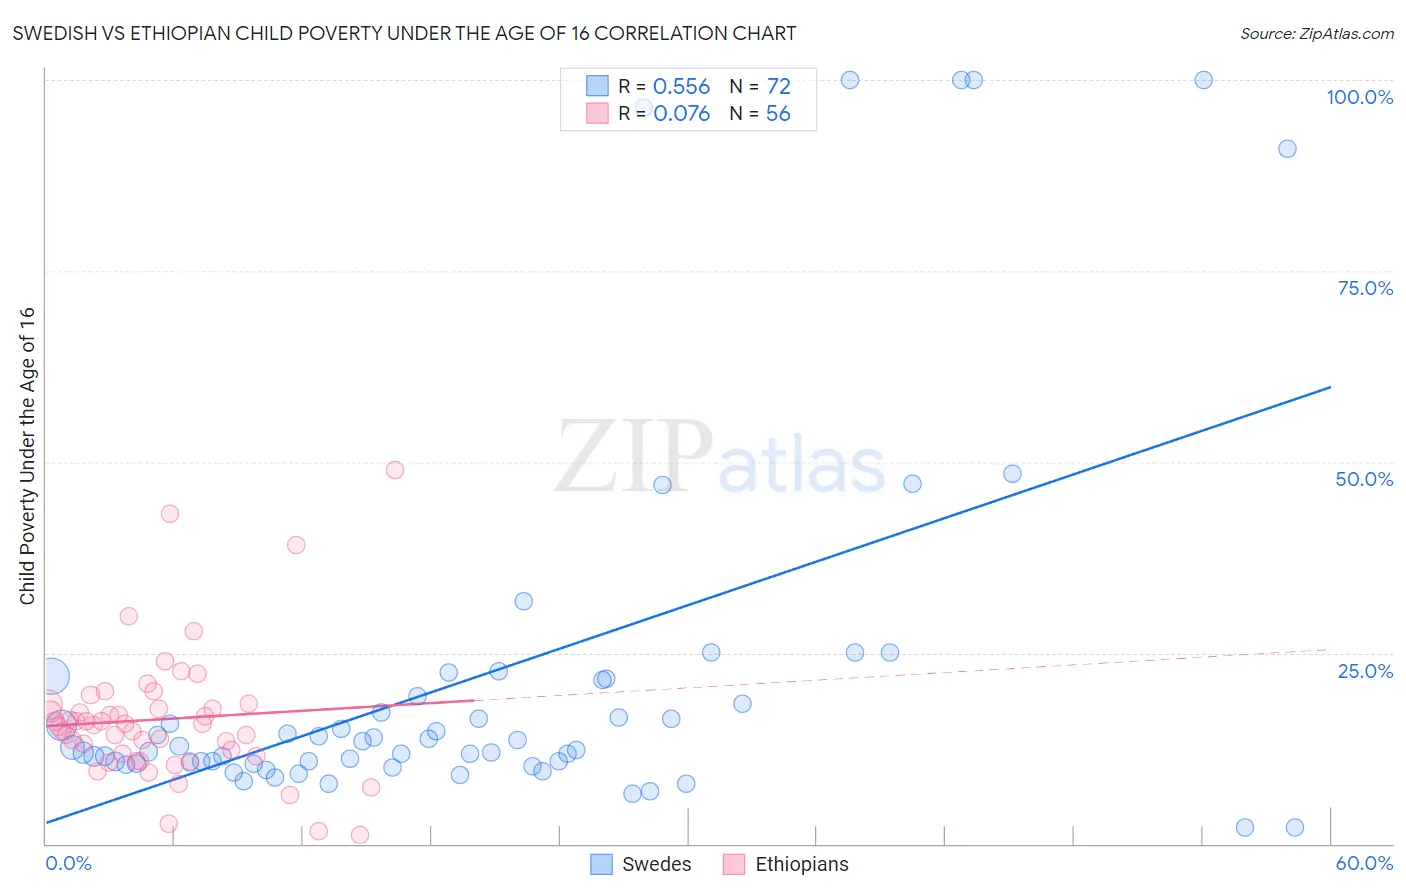
Swedish vs Ethiopian Child Poverty Under the Age of 16 Correlation Chart

The statistical analysis conducted on geographies consisting of 528,238,161 people shows a substantial positive correlation between the proportion of Swedes and poverty level among children under the age of 16 in the United States with a correlation coefficient (R) of 0.556 and weighted average of 13.3%. Similarly, the statistical analysis conducted on geographies consisting of 222,374,928 people shows a slight positive correlation between the proportion of Ethiopians and poverty level among children under the age of 16 in the United States with a correlation coefficient (R) of 0.076 and weighted average of 16.3%, a difference of 22.5%.
Swedish vs Ethiopian Child Poverty Under the Age of 16

Child Poverty Under the Age of 16 Correlation Summary

MeasurementSwedishEthiopian
Minimum2.1%1.2%
Maximum100.0%48.9%
Range97.9%47.6%
Mean21.9%16.3%
Median12.7%15.6%
Interquartile 25% (IQ1)10.6%11.6%
Interquartile 75% (IQ3)20.4%18.0%
Interquartile Range (IQR)9.8%6.3%
Standard Deviation (Sample)24.6%8.6%
Standard Deviation (Population)24.5%8.5%

Similar Demographics by Child Poverty Under the Age of 16

Demographics Similar to Swedes by Child Poverty Under the Age of 16

In terms of child poverty under the age of 16, the demographic groups most similar to Swedes are Assyrian/Chaldean/Syriac (13.3%, a difference of 0.18%), Turkish (13.4%, a difference of 0.30%), Immigrants from China (13.3%, a difference of 0.42%), Danish (13.4%, a difference of 0.51%), and Tongan (13.4%, a difference of 0.52%).
DemographicsRating | RankChild Poverty Under the Age of 16
Maltese
99.8
/100
|
#22
Exceptional
13.1%
Indians (Asian)
99.8
/100
|
#23
Exceptional
13.1%
Latvians
99.8
/100
|
#24
Exceptional
13.2%
Eastern Europeans
99.8
/100
|
#25
Exceptional
13.2%
Bolivians
99.8
/100
|
#26
Exceptional
13.2%
Immigrants | China
99.8
/100
|
#27
Exceptional
13.3%
Assyrians/Chaldeans/Syriacs
99.7
/100
|
#28
Exceptional
13.3%
Swedes
99.7
/100
|
#29
Exceptional
13.3%
Turks
99.7
/100
|
#30
Exceptional
13.4%
Danes
99.7
/100
|
#31
Exceptional
13.4%
Tongans
99.7
/100
|
#32
Exceptional
13.4%
Asians
99.6
/100
|
#33
Exceptional
13.5%
Russians
99.6
/100
|
#34
Exceptional
13.5%
Lithuanians
99.6
/100
|
#35
Exceptional
13.5%
Immigrants | Northern Europe
99.6
/100
|
#36
Exceptional
13.6%

Demographics Similar to Ethiopians by Child Poverty Under the Age of 16

In terms of child poverty under the age of 16, the demographic groups most similar to Ethiopians are Immigrants from Ethiopia (16.4%, a difference of 0.13%), Immigrants from Syria (16.4%, a difference of 0.13%), South American Indian (16.4%, a difference of 0.19%), Lebanese (16.3%, a difference of 0.30%), and Immigrants from South America (16.4%, a difference of 0.31%).
DemographicsRating | RankChild Poverty Under the Age of 16
Immigrants | Colombia
54.4
/100
|
#170
Average
16.1%
Hungarians
52.5
/100
|
#171
Average
16.2%
Afghans
52.3
/100
|
#172
Average
16.2%
Immigrants | Saudi Arabia
52.1
/100
|
#173
Average
16.2%
Whites/Caucasians
50.0
/100
|
#174
Average
16.2%
Scotch-Irish
47.1
/100
|
#175
Average
16.3%
Lebanese
45.9
/100
|
#176
Average
16.3%
Ethiopians
43.4
/100
|
#177
Average
16.3%
Immigrants | Ethiopia
42.3
/100
|
#178
Average
16.4%
Immigrants | Syria
42.3
/100
|
#179
Average
16.4%
South American Indians
41.8
/100
|
#180
Average
16.4%
Immigrants | South America
40.8
/100
|
#181
Average
16.4%
Hawaiians
38.2
/100
|
#182
Fair
16.4%
Celtics
38.2
/100
|
#183
Fair
16.4%
Immigrants | Western Asia
38.0
/100
|
#184
Fair
16.4%