Subsaharan African vs Estonian Male Poverty
COMPARE
Subsaharan African
Estonian
Male Poverty
Male Poverty Comparison
Sub-Saharan Africans
Estonians
13.3%
MALE POVERTY
0.1/ 100
METRIC RATING
268th/ 347
METRIC RANK
10.1%
MALE POVERTY
98.1/ 100
METRIC RATING
57th/ 347
METRIC RANK
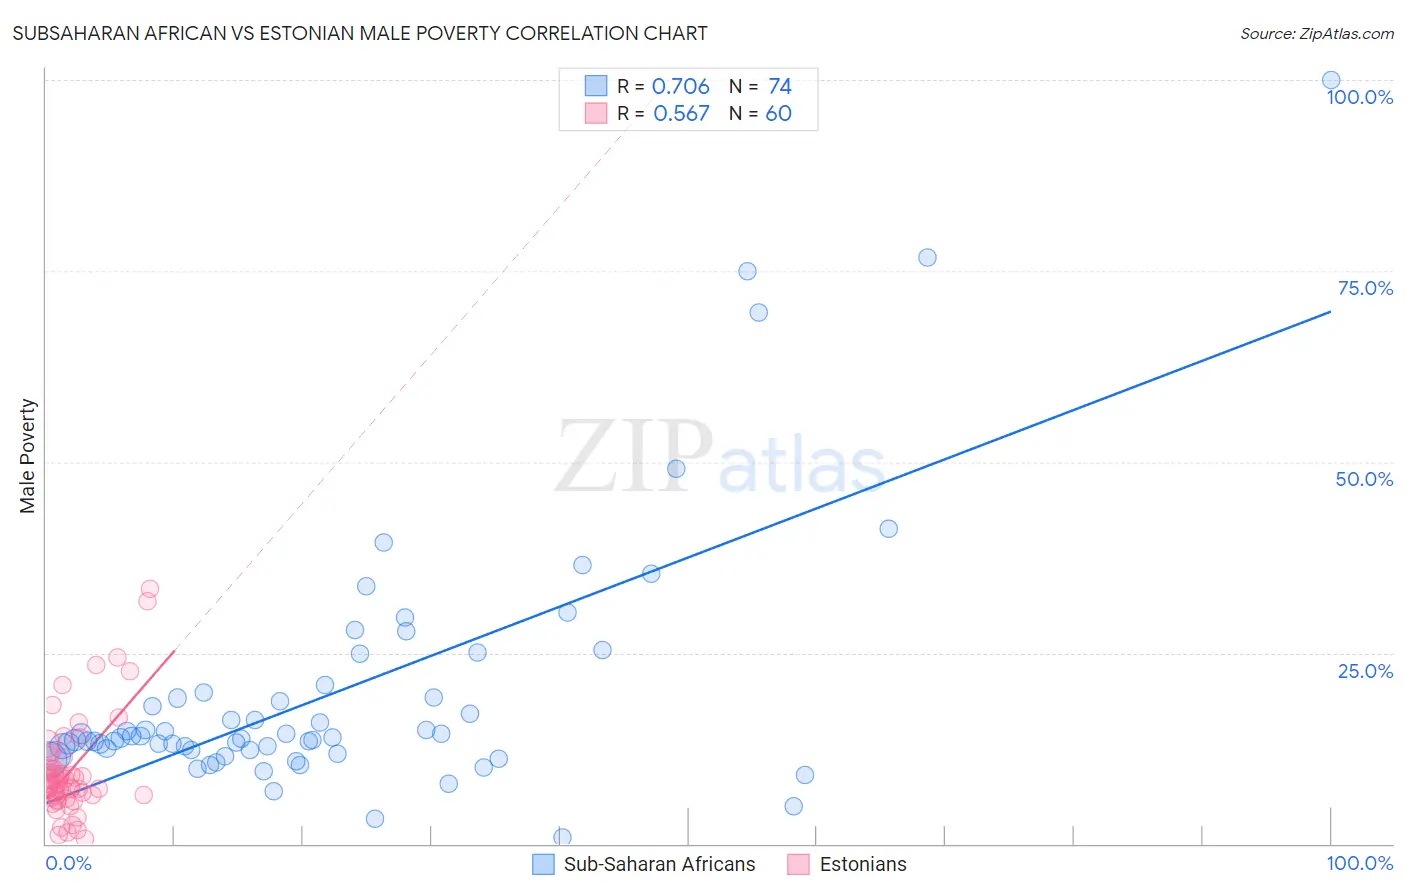
Subsaharan African vs Estonian Male Poverty Correlation Chart
The statistical analysis conducted on geographies consisting of 507,378,936 people shows a strong positive correlation between the proportion of Sub-Saharan Africans and poverty level among males in the United States with a correlation coefficient (R) of 0.706 and weighted average of 13.3%. Similarly, the statistical analysis conducted on geographies consisting of 123,489,486 people shows a substantial positive correlation between the proportion of Estonians and poverty level among males in the United States with a correlation coefficient (R) of 0.567 and weighted average of 10.1%, a difference of 31.1%.
Male Poverty Correlation Summary
| Measurement | Subsaharan African | Estonian |
| Minimum | 0.81% | 0.61% |
| Maximum | 100.0% | 33.3% |
| Range | 99.2% | 32.7% |
| Mean | 20.0% | 9.6% |
| Median | 13.9% | 8.0% |
| Interquartile 25% (IQ1) | 12.3% | 6.1% |
| Interquartile 75% (IQ3) | 19.8% | 10.6% |
| Interquartile Range (IQR) | 7.6% | 4.5% |
| Standard Deviation (Sample) | 17.2% | 6.7% |
| Standard Deviation (Population) | 17.0% | 6.7% |
Similar Demographics by Male Poverty
Demographics Similar to Sub-Saharan Africans by Male Poverty
In terms of male poverty, the demographic groups most similar to Sub-Saharan Africans are Immigrants from Jamaica (13.3%, a difference of 0.030%), Immigrants from Guyana (13.2%, a difference of 0.14%), Guyanese (13.3%, a difference of 0.22%), Jamaican (13.2%, a difference of 0.28%), and Iroquois (13.2%, a difference of 0.30%).
| Demographics | Rating | Rank | Male Poverty |
| Trinidadians and Tobagonians | 0.1 /100 | #261 | Tragic 13.1% |
| Spanish American Indians | 0.1 /100 | #262 | Tragic 13.1% |
| Central Americans | 0.1 /100 | #263 | Tragic 13.2% |
| Iroquois | 0.1 /100 | #264 | Tragic 13.2% |
| Jamaicans | 0.1 /100 | #265 | Tragic 13.2% |
| Immigrants | Guyana | 0.1 /100 | #266 | Tragic 13.2% |
| Immigrants | Jamaica | 0.1 /100 | #267 | Tragic 13.3% |
| Sub-Saharan Africans | 0.1 /100 | #268 | Tragic 13.3% |
| Guyanese | 0.0 /100 | #269 | Tragic 13.3% |
| Cree | 0.0 /100 | #270 | Tragic 13.3% |
| Spanish Americans | 0.0 /100 | #271 | Tragic 13.4% |
| Immigrants | Bahamas | 0.0 /100 | #272 | Tragic 13.5% |
| Chickasaw | 0.0 /100 | #273 | Tragic 13.5% |
| Immigrants | West Indies | 0.0 /100 | #274 | Tragic 13.5% |
| Barbadians | 0.0 /100 | #275 | Tragic 13.6% |
Demographics Similar to Estonians by Male Poverty
In terms of male poverty, the demographic groups most similar to Estonians are Scandinavian (10.1%, a difference of 0.070%), Immigrants from Bulgaria (10.1%, a difference of 0.14%), Immigrants from Europe (10.1%, a difference of 0.21%), Ukrainian (10.1%, a difference of 0.30%), and Austrian (10.1%, a difference of 0.31%).
| Demographics | Rating | Rank | Male Poverty |
| Immigrants | Philippines | 98.7 /100 | #50 | Exceptional 10.0% |
| Immigrants | Croatia | 98.7 /100 | #51 | Exceptional 10.0% |
| Asians | 98.7 /100 | #52 | Exceptional 10.0% |
| Immigrants | Czechoslovakia | 98.6 /100 | #53 | Exceptional 10.0% |
| Immigrants | Austria | 98.5 /100 | #54 | Exceptional 10.0% |
| Germans | 98.3 /100 | #55 | Exceptional 10.1% |
| Immigrants | Bulgaria | 98.2 /100 | #56 | Exceptional 10.1% |
| Estonians | 98.1 /100 | #57 | Exceptional 10.1% |
| Scandinavians | 98.0 /100 | #58 | Exceptional 10.1% |
| Immigrants | Europe | 97.9 /100 | #59 | Exceptional 10.1% |
| Ukrainians | 97.9 /100 | #60 | Exceptional 10.1% |
| Austrians | 97.8 /100 | #61 | Exceptional 10.1% |
| Immigrants | Italy | 97.8 /100 | #62 | Exceptional 10.2% |
| Slovaks | 97.7 /100 | #63 | Exceptional 10.2% |
| Swiss | 97.5 /100 | #64 | Exceptional 10.2% |