Chickasaw vs Estonian Male Poverty
COMPARE
Chickasaw
Estonian
Male Poverty
Male Poverty Comparison
Chickasaw
Estonians
13.5%
MALE POVERTY
0.0/ 100
METRIC RATING
273rd/ 347
METRIC RANK
10.1%
MALE POVERTY
98.1/ 100
METRIC RATING
57th/ 347
METRIC RANK
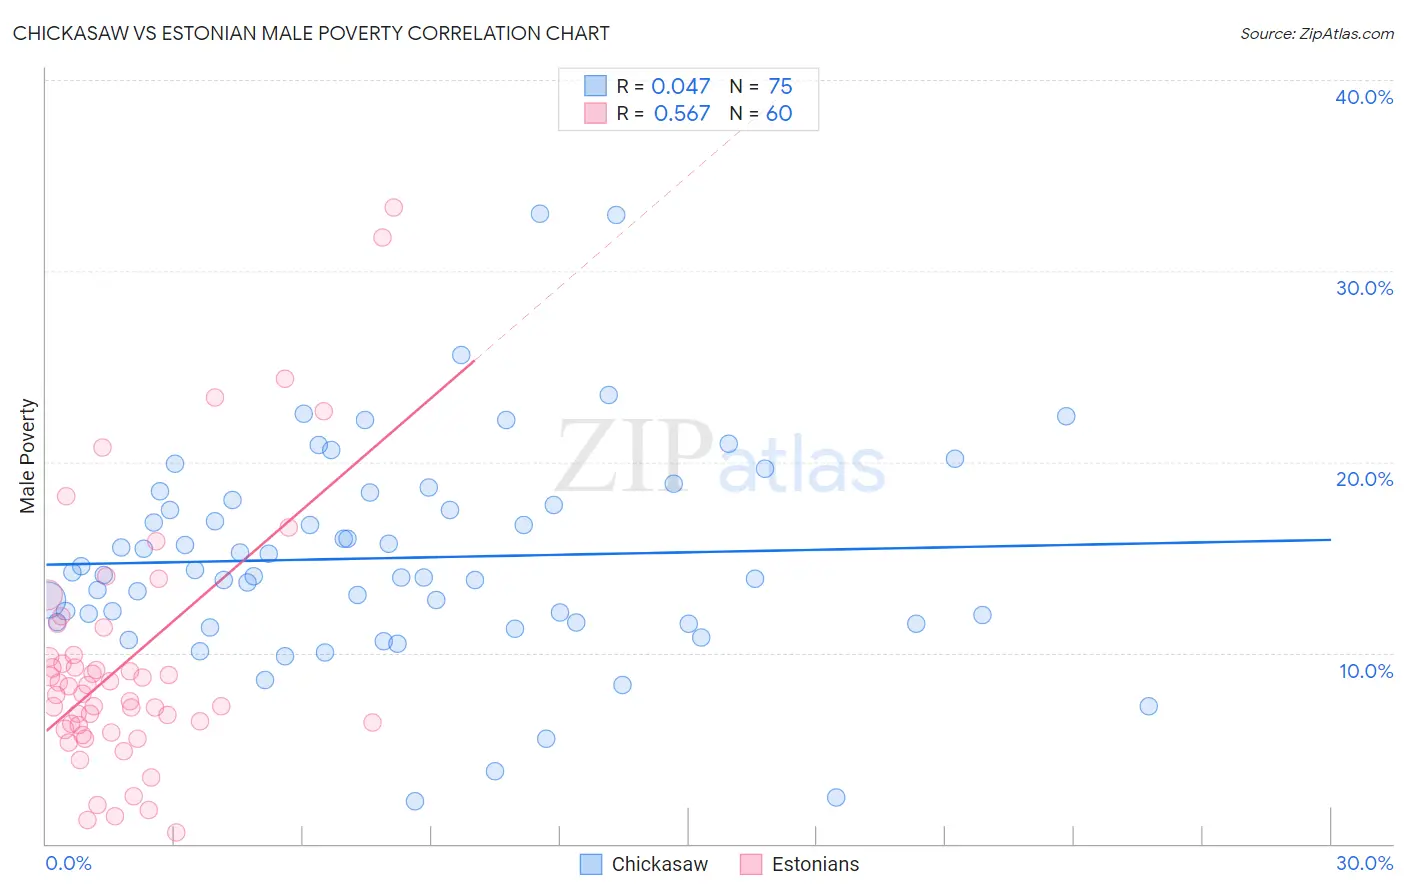
Chickasaw vs Estonian Male Poverty Correlation Chart
The statistical analysis conducted on geographies consisting of 147,660,855 people shows no correlation between the proportion of Chickasaw and poverty level among males in the United States with a correlation coefficient (R) of 0.047 and weighted average of 13.5%. Similarly, the statistical analysis conducted on geographies consisting of 123,489,486 people shows a substantial positive correlation between the proportion of Estonians and poverty level among males in the United States with a correlation coefficient (R) of 0.567 and weighted average of 10.1%, a difference of 33.4%.
Male Poverty Correlation Summary
| Measurement | Chickasaw | Estonian |
| Minimum | 2.2% | 0.61% |
| Maximum | 33.0% | 33.3% |
| Range | 30.8% | 32.7% |
| Mean | 15.0% | 9.6% |
| Median | 14.0% | 8.0% |
| Interquartile 25% (IQ1) | 11.6% | 6.1% |
| Interquartile 75% (IQ3) | 18.0% | 10.6% |
| Interquartile Range (IQR) | 6.4% | 4.5% |
| Standard Deviation (Sample) | 5.6% | 6.7% |
| Standard Deviation (Population) | 5.5% | 6.7% |
Similar Demographics by Male Poverty
Demographics Similar to Chickasaw by Male Poverty
In terms of male poverty, the demographic groups most similar to Chickasaw are Immigrants from West Indies (13.5%, a difference of 0.070%), Immigrants from Bahamas (13.5%, a difference of 0.29%), Barbadian (13.6%, a difference of 0.70%), Immigrants from Latin America (13.6%, a difference of 0.89%), and Bangladeshi (13.6%, a difference of 1.0%).
| Demographics | Rating | Rank | Male Poverty |
| Immigrants | Guyana | 0.1 /100 | #266 | Tragic 13.2% |
| Immigrants | Jamaica | 0.1 /100 | #267 | Tragic 13.3% |
| Sub-Saharan Africans | 0.1 /100 | #268 | Tragic 13.3% |
| Guyanese | 0.0 /100 | #269 | Tragic 13.3% |
| Cree | 0.0 /100 | #270 | Tragic 13.3% |
| Spanish Americans | 0.0 /100 | #271 | Tragic 13.4% |
| Immigrants | Bahamas | 0.0 /100 | #272 | Tragic 13.5% |
| Chickasaw | 0.0 /100 | #273 | Tragic 13.5% |
| Immigrants | West Indies | 0.0 /100 | #274 | Tragic 13.5% |
| Barbadians | 0.0 /100 | #275 | Tragic 13.6% |
| Immigrants | Latin America | 0.0 /100 | #276 | Tragic 13.6% |
| Bangladeshis | 0.0 /100 | #277 | Tragic 13.6% |
| Belizeans | 0.0 /100 | #278 | Tragic 13.6% |
| Haitians | 0.0 /100 | #279 | Tragic 13.7% |
| Mexicans | 0.0 /100 | #280 | Tragic 13.7% |
Demographics Similar to Estonians by Male Poverty
In terms of male poverty, the demographic groups most similar to Estonians are Scandinavian (10.1%, a difference of 0.070%), Immigrants from Bulgaria (10.1%, a difference of 0.14%), Immigrants from Europe (10.1%, a difference of 0.21%), Ukrainian (10.1%, a difference of 0.30%), and Austrian (10.1%, a difference of 0.31%).
| Demographics | Rating | Rank | Male Poverty |
| Immigrants | Philippines | 98.7 /100 | #50 | Exceptional 10.0% |
| Immigrants | Croatia | 98.7 /100 | #51 | Exceptional 10.0% |
| Asians | 98.7 /100 | #52 | Exceptional 10.0% |
| Immigrants | Czechoslovakia | 98.6 /100 | #53 | Exceptional 10.0% |
| Immigrants | Austria | 98.5 /100 | #54 | Exceptional 10.0% |
| Germans | 98.3 /100 | #55 | Exceptional 10.1% |
| Immigrants | Bulgaria | 98.2 /100 | #56 | Exceptional 10.1% |
| Estonians | 98.1 /100 | #57 | Exceptional 10.1% |
| Scandinavians | 98.0 /100 | #58 | Exceptional 10.1% |
| Immigrants | Europe | 97.9 /100 | #59 | Exceptional 10.1% |
| Ukrainians | 97.9 /100 | #60 | Exceptional 10.1% |
| Austrians | 97.8 /100 | #61 | Exceptional 10.1% |
| Immigrants | Italy | 97.8 /100 | #62 | Exceptional 10.2% |
| Slovaks | 97.7 /100 | #63 | Exceptional 10.2% |
| Swiss | 97.5 /100 | #64 | Exceptional 10.2% |