Subsaharan African vs Creek Child Poverty Among Girls Under 16
COMPARE
Subsaharan African
Creek
Child Poverty Among Girls Under 16
Child Poverty Among Girls Under 16 Comparison
Sub-Saharan Africans
Creek
20.1%
CHILD POVERTY AMONG GIRLS UNDER 16
0.0/ 100
METRIC RATING
275th/ 347
METRIC RANK
21.7%
CHILD POVERTY AMONG GIRLS UNDER 16
0.0/ 100
METRIC RATING
313th/ 347
METRIC RANK
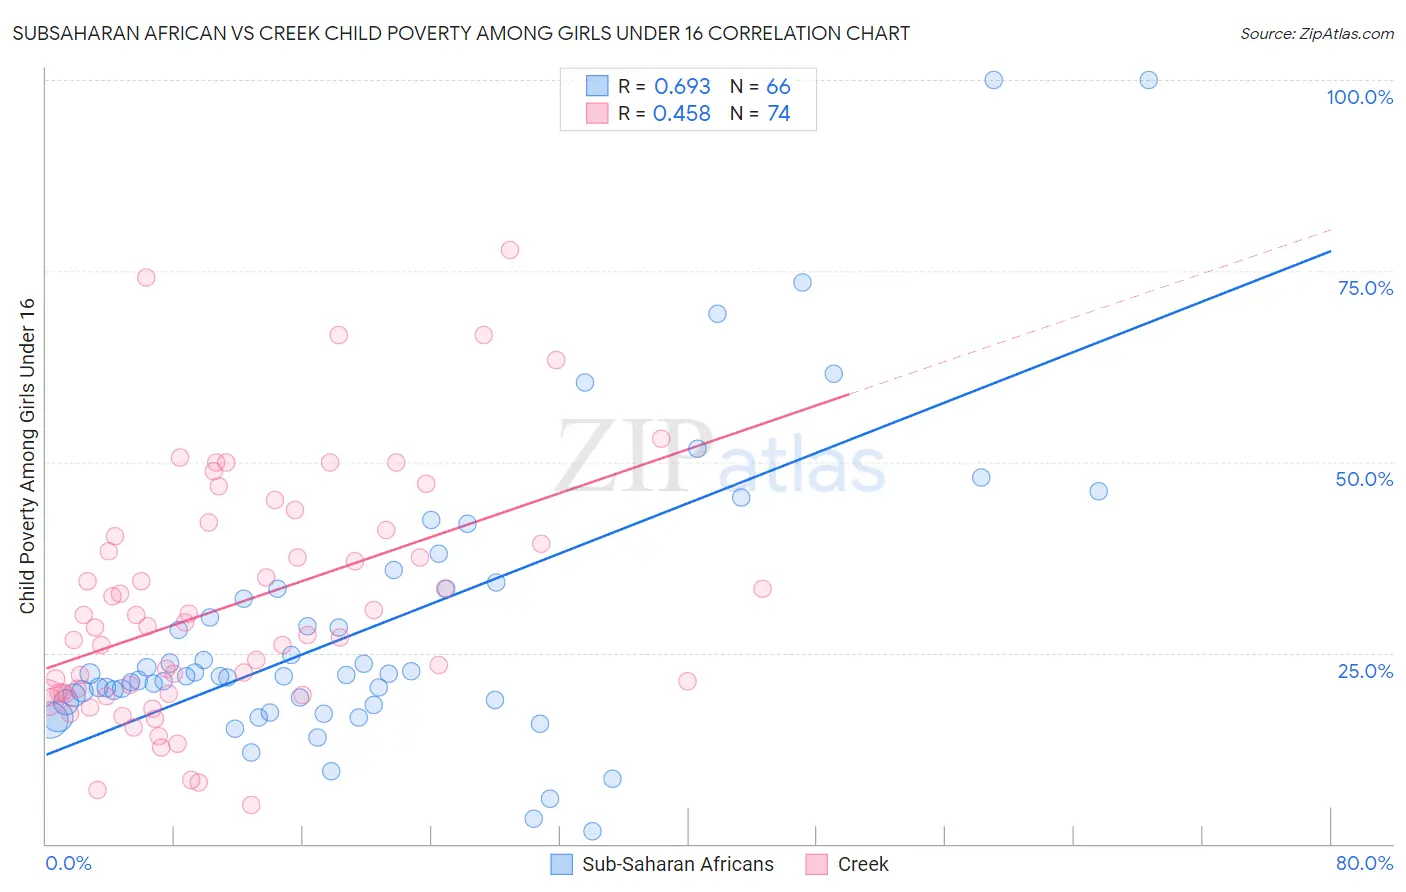
Subsaharan African vs Creek Child Poverty Among Girls Under 16 Correlation Chart
The statistical analysis conducted on geographies consisting of 496,899,151 people shows a significant positive correlation between the proportion of Sub-Saharan Africans and poverty level among girls under the age of 16 in the United States with a correlation coefficient (R) of 0.693 and weighted average of 20.1%. Similarly, the statistical analysis conducted on geographies consisting of 177,262,374 people shows a moderate positive correlation between the proportion of Creek and poverty level among girls under the age of 16 in the United States with a correlation coefficient (R) of 0.458 and weighted average of 21.7%, a difference of 8.1%.
Child Poverty Among Girls Under 16 Correlation Summary
| Measurement | Subsaharan African | Creek |
| Minimum | 1.7% | 5.1% |
| Maximum | 100.0% | 77.8% |
| Range | 98.3% | 72.7% |
| Mean | 28.3% | 31.3% |
| Median | 21.9% | 28.4% |
| Interquartile 25% (IQ1) | 18.5% | 19.7% |
| Interquartile 75% (IQ3) | 33.3% | 40.3% |
| Interquartile Range (IQR) | 14.8% | 20.7% |
| Standard Deviation (Sample) | 19.2% | 15.8% |
| Standard Deviation (Population) | 19.1% | 15.7% |
Similar Demographics by Child Poverty Among Girls Under 16
Demographics Similar to Sub-Saharan Africans by Child Poverty Among Girls Under 16
In terms of child poverty among girls under 16, the demographic groups most similar to Sub-Saharan Africans are Immigrants from St. Vincent and the Grenadines (20.1%, a difference of 0.14%), Comanche (20.2%, a difference of 0.32%), Belizean (20.2%, a difference of 0.43%), Barbadian (20.2%, a difference of 0.46%), and Bangladeshi (20.0%, a difference of 0.57%).
| Demographics | Rating | Rank | Child Poverty Among Girls Under 16 |
| Spanish American Indians | 0.1 /100 | #268 | Tragic 19.9% |
| Liberians | 0.1 /100 | #269 | Tragic 19.9% |
| Cherokee | 0.1 /100 | #270 | Tragic 19.9% |
| Immigrants | Barbados | 0.1 /100 | #271 | Tragic 19.9% |
| Immigrants | El Salvador | 0.1 /100 | #272 | Tragic 20.0% |
| Bangladeshis | 0.1 /100 | #273 | Tragic 20.0% |
| Immigrants | St. Vincent and the Grenadines | 0.0 /100 | #274 | Tragic 20.1% |
| Sub-Saharan Africans | 0.0 /100 | #275 | Tragic 20.1% |
| Comanche | 0.0 /100 | #276 | Tragic 20.2% |
| Belizeans | 0.0 /100 | #277 | Tragic 20.2% |
| Barbadians | 0.0 /100 | #278 | Tragic 20.2% |
| Immigrants | Zaire | 0.0 /100 | #279 | Tragic 20.2% |
| Immigrants | Liberia | 0.0 /100 | #280 | Tragic 20.2% |
| Central Americans | 0.0 /100 | #281 | Tragic 20.2% |
| West Indians | 0.0 /100 | #282 | Tragic 20.3% |
Demographics Similar to Creek by Child Poverty Among Girls Under 16
In terms of child poverty among girls under 16, the demographic groups most similar to Creek are Arapaho (21.7%, a difference of 0.010%), Ute (21.8%, a difference of 0.29%), Immigrants from Mexico (21.6%, a difference of 0.50%), Immigrants from Guatemala (21.9%, a difference of 0.56%), and Dutch West Indian (21.6%, a difference of 0.73%).
| Demographics | Rating | Rank | Child Poverty Among Girls Under 16 |
| Immigrants | Central America | 0.0 /100 | #306 | Tragic 21.4% |
| Immigrants | Bahamas | 0.0 /100 | #307 | Tragic 21.4% |
| Houma | 0.0 /100 | #308 | Tragic 21.5% |
| Bahamians | 0.0 /100 | #309 | Tragic 21.5% |
| Immigrants | Somalia | 0.0 /100 | #310 | Tragic 21.6% |
| Dutch West Indians | 0.0 /100 | #311 | Tragic 21.6% |
| Immigrants | Mexico | 0.0 /100 | #312 | Tragic 21.6% |
| Creek | 0.0 /100 | #313 | Tragic 21.7% |
| Arapaho | 0.0 /100 | #314 | Tragic 21.7% |
| Ute | 0.0 /100 | #315 | Tragic 21.8% |
| Immigrants | Guatemala | 0.0 /100 | #316 | Tragic 21.9% |
| Africans | 0.0 /100 | #317 | Tragic 21.9% |
| Immigrants | Dominica | 0.0 /100 | #318 | Tragic 22.1% |
| U.S. Virgin Islanders | 0.0 /100 | #319 | Tragic 22.1% |
| Hondurans | 0.0 /100 | #320 | Tragic 22.2% |