Sri Lankan vs Bhutanese Single Female Poverty
COMPARE
Sri Lankan
Bhutanese
Single Female Poverty
Single Female Poverty Comparison
Sri Lankans
Bhutanese
19.2%
SINGLE FEMALE POVERTY
99.6/ 100
METRIC RATING
59th/ 347
METRIC RANK
17.7%
SINGLE FEMALE POVERTY
100.0/ 100
METRIC RATING
9th/ 347
METRIC RANK
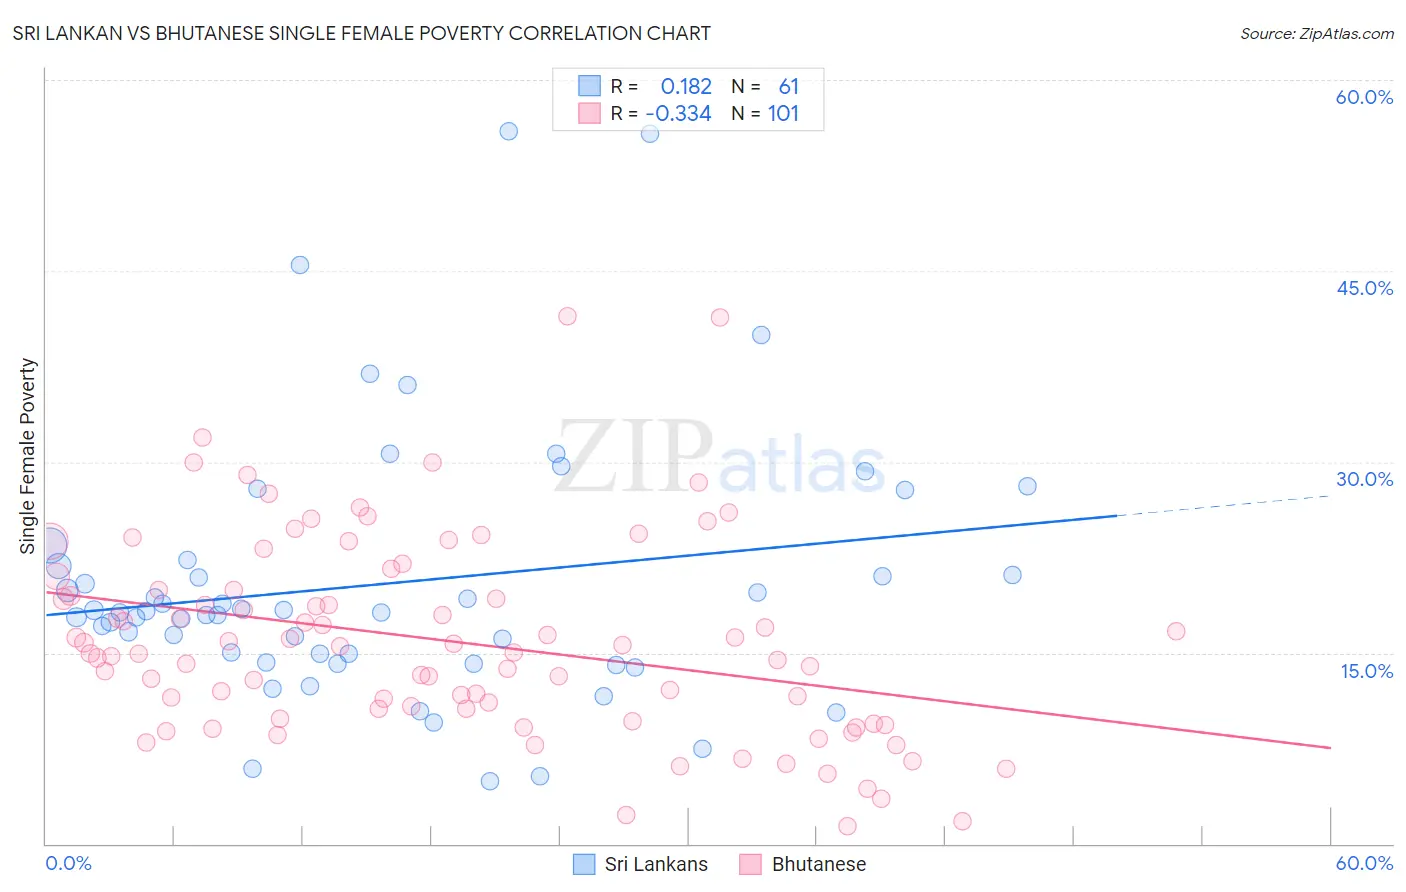
Sri Lankan vs Bhutanese Single Female Poverty Correlation Chart
The statistical analysis conducted on geographies consisting of 433,414,955 people shows a poor positive correlation between the proportion of Sri Lankans and poverty level among single females in the United States with a correlation coefficient (R) of 0.182 and weighted average of 19.2%. Similarly, the statistical analysis conducted on geographies consisting of 446,564,428 people shows a mild negative correlation between the proportion of Bhutanese and poverty level among single females in the United States with a correlation coefficient (R) of -0.334 and weighted average of 17.7%, a difference of 8.3%.
Single Female Poverty Correlation Summary
| Measurement | Sri Lankan | Bhutanese |
| Minimum | 4.9% | 1.3% |
| Maximum | 56.0% | 41.4% |
| Range | 51.1% | 40.1% |
| Mean | 20.4% | 15.9% |
| Median | 18.2% | 15.1% |
| Interquartile 25% (IQ1) | 14.6% | 10.2% |
| Interquartile 75% (IQ3) | 22.0% | 19.9% |
| Interquartile Range (IQR) | 7.5% | 9.7% |
| Standard Deviation (Sample) | 10.3% | 7.8% |
| Standard Deviation (Population) | 10.3% | 7.8% |
Similar Demographics by Single Female Poverty
Demographics Similar to Sri Lankans by Single Female Poverty
In terms of single female poverty, the demographic groups most similar to Sri Lankans are Immigrants from Bulgaria (19.1%, a difference of 0.10%), Russian (19.2%, a difference of 0.10%), Cambodian (19.2%, a difference of 0.12%), Lithuanian (19.2%, a difference of 0.17%), and Eastern European (19.1%, a difference of 0.22%).
| Demographics | Rating | Rank | Single Female Poverty |
| Egyptians | 99.7 /100 | #52 | Exceptional 19.1% |
| Tsimshian | 99.7 /100 | #53 | Exceptional 19.1% |
| Argentineans | 99.7 /100 | #54 | Exceptional 19.1% |
| Immigrants | Vietnam | 99.7 /100 | #55 | Exceptional 19.1% |
| Immigrants | Fiji | 99.7 /100 | #56 | Exceptional 19.1% |
| Eastern Europeans | 99.7 /100 | #57 | Exceptional 19.1% |
| Immigrants | Bulgaria | 99.7 /100 | #58 | Exceptional 19.1% |
| Sri Lankans | 99.6 /100 | #59 | Exceptional 19.2% |
| Russians | 99.6 /100 | #60 | Exceptional 19.2% |
| Cambodians | 99.6 /100 | #61 | Exceptional 19.2% |
| Lithuanians | 99.6 /100 | #62 | Exceptional 19.2% |
| Immigrants | Northern Europe | 99.6 /100 | #63 | Exceptional 19.2% |
| Immigrants | Europe | 99.6 /100 | #64 | Exceptional 19.2% |
| Cypriots | 99.6 /100 | #65 | Exceptional 19.2% |
| Palestinians | 99.6 /100 | #66 | Exceptional 19.2% |
Demographics Similar to Bhutanese by Single Female Poverty
In terms of single female poverty, the demographic groups most similar to Bhutanese are Immigrants from Ireland (17.8%, a difference of 0.41%), Immigrants from Lithuania (17.8%, a difference of 0.50%), Immigrants from South Central Asia (17.8%, a difference of 0.56%), Immigrants from Bolivia (17.8%, a difference of 0.82%), and Bolivian (17.9%, a difference of 1.3%).
| Demographics | Rating | Rank | Single Female Poverty |
| Immigrants | Taiwan | 100.0 /100 | #2 | Exceptional 16.4% |
| Immigrants | Hong Kong | 100.0 /100 | #3 | Exceptional 16.5% |
| Immigrants | India | 100.0 /100 | #4 | Exceptional 16.8% |
| Assyrians/Chaldeans/Syriacs | 100.0 /100 | #5 | Exceptional 17.0% |
| Filipinos | 100.0 /100 | #6 | Exceptional 17.0% |
| Thais | 100.0 /100 | #7 | Exceptional 17.3% |
| Immigrants | Iran | 100.0 /100 | #8 | Exceptional 17.5% |
| Bhutanese | 100.0 /100 | #9 | Exceptional 17.7% |
| Immigrants | Ireland | 100.0 /100 | #10 | Exceptional 17.8% |
| Immigrants | Lithuania | 100.0 /100 | #11 | Exceptional 17.8% |
| Immigrants | South Central Asia | 100.0 /100 | #12 | Exceptional 17.8% |
| Immigrants | Bolivia | 100.0 /100 | #13 | Exceptional 17.8% |
| Bolivians | 100.0 /100 | #14 | Exceptional 17.9% |
| Indians (Asian) | 100.0 /100 | #15 | Exceptional 17.9% |
| Iranians | 100.0 /100 | #16 | Exceptional 18.0% |