Spanish vs Immigrants from Canada Seniors Poverty Over the Age of 75
COMPARE
Spanish
Immigrants from Canada
Seniors Poverty Over the Age of 75
Seniors Poverty Over the Age of 75 Comparison
Spanish
Immigrants from Canada
11.8%
SENIORS POVERTY OVER THE AGE OF 75
80.5/ 100
METRIC RATING
130th/ 347
METRIC RANK
11.2%
SENIORS POVERTY OVER THE AGE OF 75
97.9/ 100
METRIC RATING
57th/ 347
METRIC RANK
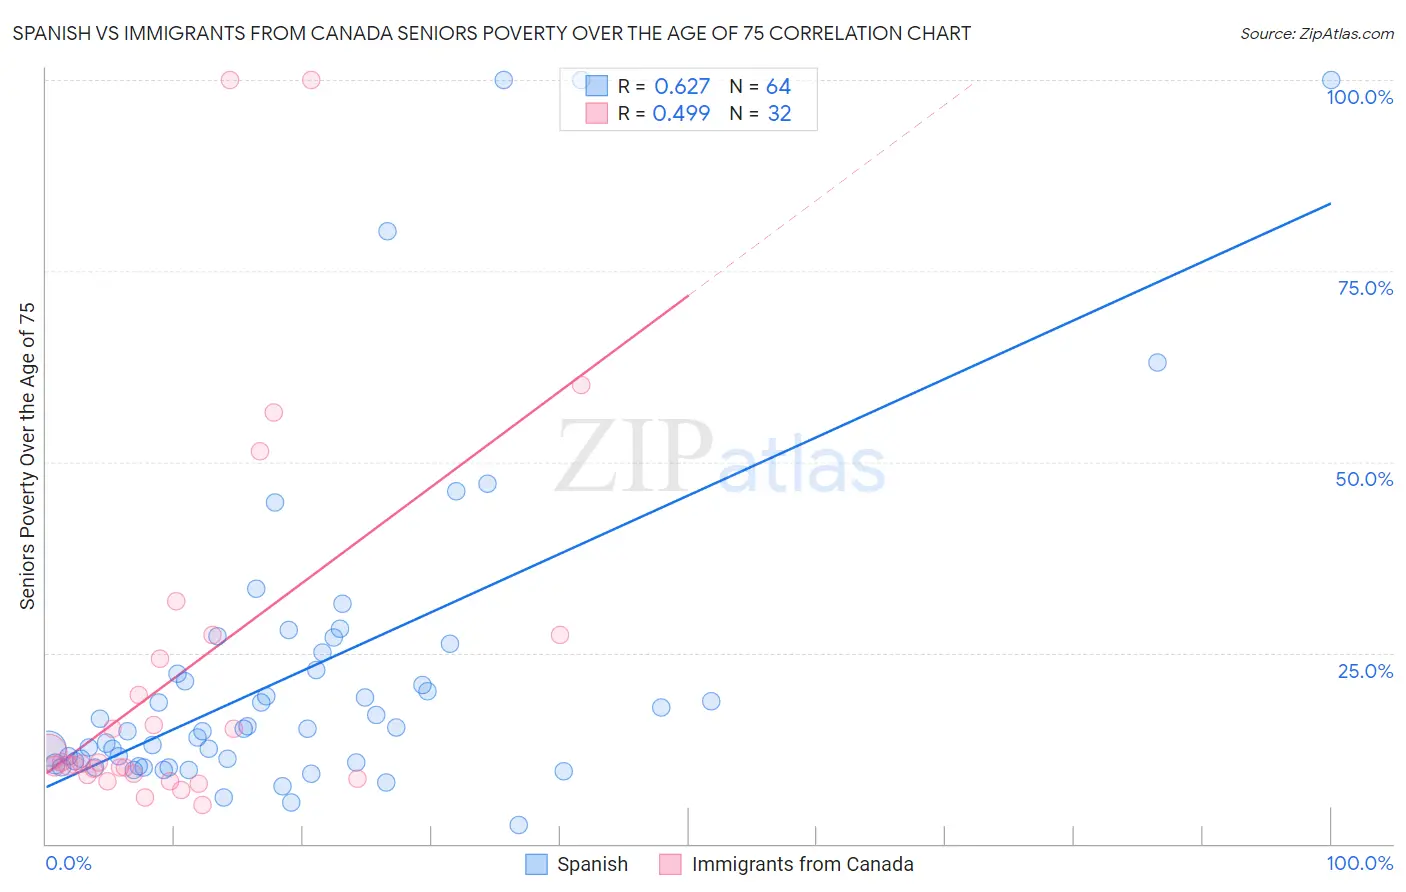
Spanish vs Immigrants from Canada Seniors Poverty Over the Age of 75 Correlation Chart
The statistical analysis conducted on geographies consisting of 416,617,301 people shows a significant positive correlation between the proportion of Spanish and poverty level among seniors over the age of 75 in the United States with a correlation coefficient (R) of 0.627 and weighted average of 11.8%. Similarly, the statistical analysis conducted on geographies consisting of 452,026,685 people shows a moderate positive correlation between the proportion of Immigrants from Canada and poverty level among seniors over the age of 75 in the United States with a correlation coefficient (R) of 0.499 and weighted average of 11.2%, a difference of 5.4%.
Seniors Poverty Over the Age of 75 Correlation Summary
| Measurement | Spanish | Immigrants from Canada |
| Minimum | 2.4% | 5.0% |
| Maximum | 100.0% | 100.0% |
| Range | 97.6% | 95.0% |
| Mean | 22.6% | 22.4% |
| Median | 15.1% | 10.5% |
| Interquartile 25% (IQ1) | 10.6% | 9.1% |
| Interquartile 75% (IQ3) | 23.9% | 25.8% |
| Interquartile Range (IQR) | 13.3% | 16.7% |
| Standard Deviation (Sample) | 21.8% | 24.9% |
| Standard Deviation (Population) | 21.7% | 24.5% |
Similar Demographics by Seniors Poverty Over the Age of 75
Demographics Similar to Spanish by Seniors Poverty Over the Age of 75
In terms of seniors poverty over the age of 75, the demographic groups most similar to Spanish are Ethiopian (11.8%, a difference of 0.020%), Immigrants from Western Europe (11.9%, a difference of 0.12%), Immigrants from Hungary (11.8%, a difference of 0.17%), Lebanese (11.9%, a difference of 0.28%), and Immigrants from Denmark (11.8%, a difference of 0.29%).
| Demographics | Rating | Rank | Seniors Poverty Over the Age of 75 |
| Immigrants | Italy | 84.0 /100 | #123 | Excellent 11.8% |
| Fijians | 83.8 /100 | #124 | Excellent 11.8% |
| Sudanese | 83.6 /100 | #125 | Excellent 11.8% |
| Pennsylvania Germans | 83.4 /100 | #126 | Excellent 11.8% |
| Immigrants | Denmark | 82.6 /100 | #127 | Excellent 11.8% |
| Immigrants | Hungary | 81.7 /100 | #128 | Excellent 11.8% |
| Ethiopians | 80.7 /100 | #129 | Excellent 11.8% |
| Spanish | 80.5 /100 | #130 | Excellent 11.8% |
| Immigrants | Western Europe | 79.6 /100 | #131 | Good 11.9% |
| Lebanese | 78.3 /100 | #132 | Good 11.9% |
| Immigrants | Sierra Leone | 77.6 /100 | #133 | Good 11.9% |
| Ugandans | 77.1 /100 | #134 | Good 11.9% |
| Immigrants | Ireland | 76.2 /100 | #135 | Good 11.9% |
| Immigrants | Philippines | 75.0 /100 | #136 | Good 11.9% |
| Immigrants | Moldova | 74.1 /100 | #137 | Good 11.9% |
Demographics Similar to Immigrants from Canada by Seniors Poverty Over the Age of 75
In terms of seniors poverty over the age of 75, the demographic groups most similar to Immigrants from Canada are Yugoslavian (11.2%, a difference of 0.040%), Immigrants from Netherlands (11.2%, a difference of 0.12%), Slavic (11.2%, a difference of 0.23%), Eastern European (11.3%, a difference of 0.23%), and Hungarian (11.2%, a difference of 0.24%).
| Demographics | Rating | Rank | Seniors Poverty Over the Age of 75 |
| Serbians | 98.6 /100 | #50 | Exceptional 11.1% |
| Immigrants | North Macedonia | 98.6 /100 | #51 | Exceptional 11.1% |
| Zimbabweans | 98.5 /100 | #52 | Exceptional 11.2% |
| Immigrants | England | 98.4 /100 | #53 | Exceptional 11.2% |
| Afghans | 98.2 /100 | #54 | Exceptional 11.2% |
| Hungarians | 98.1 /100 | #55 | Exceptional 11.2% |
| Slavs | 98.1 /100 | #56 | Exceptional 11.2% |
| Immigrants | Canada | 97.9 /100 | #57 | Exceptional 11.2% |
| Yugoslavians | 97.9 /100 | #58 | Exceptional 11.2% |
| Immigrants | Netherlands | 97.8 /100 | #59 | Exceptional 11.2% |
| Eastern Europeans | 97.7 /100 | #60 | Exceptional 11.3% |
| Canadians | 97.7 /100 | #61 | Exceptional 11.3% |
| Immigrants | North America | 97.6 /100 | #62 | Exceptional 11.3% |
| Immigrants | Afghanistan | 97.5 /100 | #63 | Exceptional 11.3% |
| Immigrants | Northern Europe | 97.4 /100 | #64 | Exceptional 11.3% |