Spanish vs Argentinean Seniors Poverty Over the Age of 75
COMPARE
Spanish
Argentinean
Seniors Poverty Over the Age of 75
Seniors Poverty Over the Age of 75 Comparison
Spanish
Argentineans
11.8%
SENIORS POVERTY OVER THE AGE OF 75
80.5/ 100
METRIC RATING
130th/ 347
METRIC RANK
13.4%
SENIORS POVERTY OVER THE AGE OF 75
0.7/ 100
METRIC RATING
240th/ 347
METRIC RANK
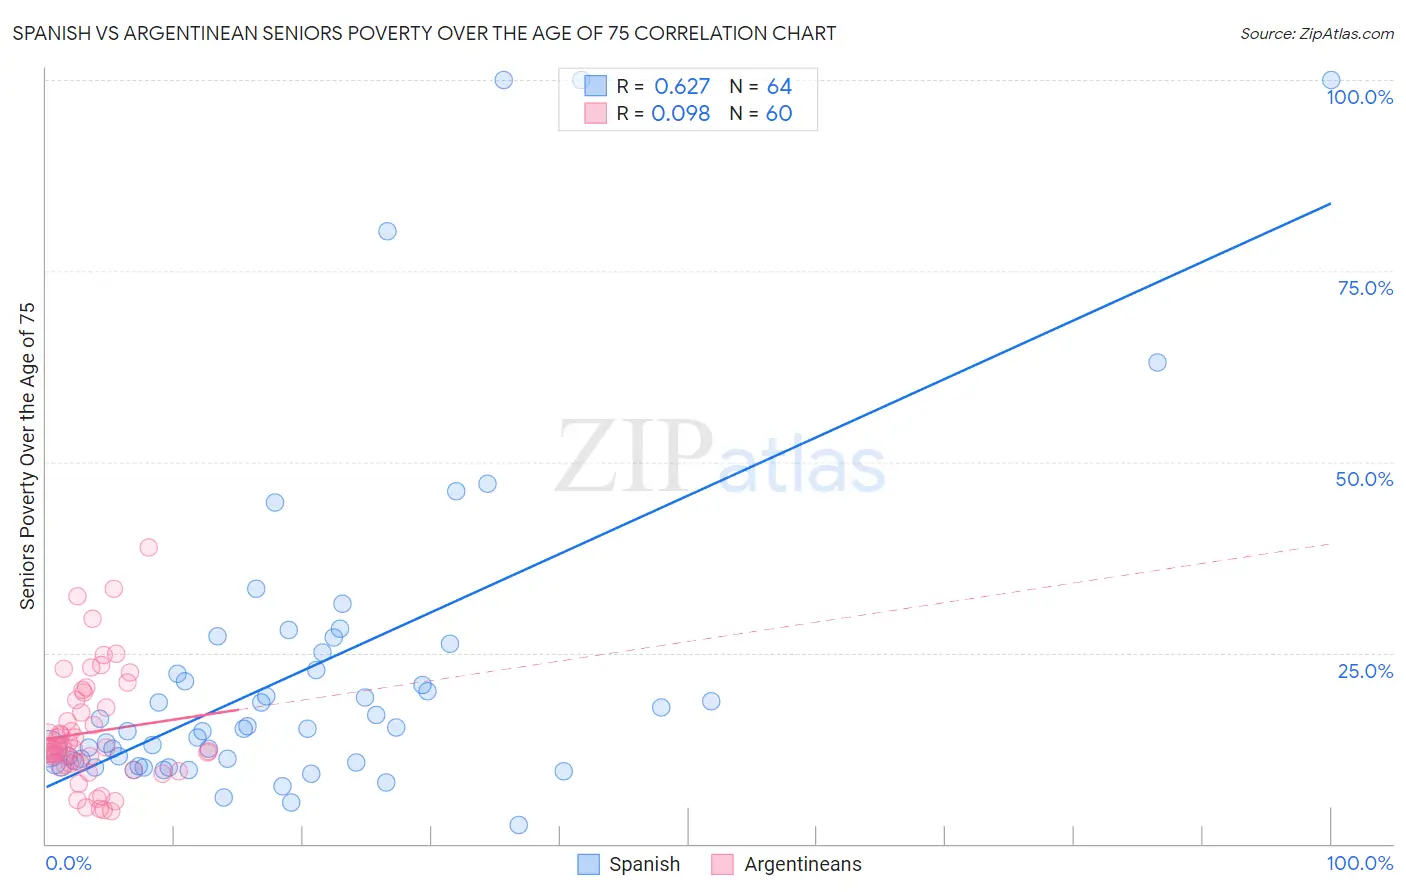
Spanish vs Argentinean Seniors Poverty Over the Age of 75 Correlation Chart
The statistical analysis conducted on geographies consisting of 416,617,301 people shows a significant positive correlation between the proportion of Spanish and poverty level among seniors over the age of 75 in the United States with a correlation coefficient (R) of 0.627 and weighted average of 11.8%. Similarly, the statistical analysis conducted on geographies consisting of 294,829,039 people shows a slight positive correlation between the proportion of Argentineans and poverty level among seniors over the age of 75 in the United States with a correlation coefficient (R) of 0.098 and weighted average of 13.4%, a difference of 13.4%.
Seniors Poverty Over the Age of 75 Correlation Summary
| Measurement | Spanish | Argentinean |
| Minimum | 2.4% | 4.3% |
| Maximum | 100.0% | 38.7% |
| Range | 97.6% | 34.4% |
| Mean | 22.6% | 14.6% |
| Median | 15.1% | 12.5% |
| Interquartile 25% (IQ1) | 10.6% | 10.4% |
| Interquartile 75% (IQ3) | 23.9% | 18.3% |
| Interquartile Range (IQR) | 13.3% | 8.0% |
| Standard Deviation (Sample) | 21.8% | 7.4% |
| Standard Deviation (Population) | 21.7% | 7.3% |
Similar Demographics by Seniors Poverty Over the Age of 75
Demographics Similar to Spanish by Seniors Poverty Over the Age of 75
In terms of seniors poverty over the age of 75, the demographic groups most similar to Spanish are Ethiopian (11.8%, a difference of 0.020%), Immigrants from Western Europe (11.9%, a difference of 0.12%), Immigrants from Hungary (11.8%, a difference of 0.17%), Lebanese (11.9%, a difference of 0.28%), and Immigrants from Denmark (11.8%, a difference of 0.29%).
| Demographics | Rating | Rank | Seniors Poverty Over the Age of 75 |
| Immigrants | Italy | 84.0 /100 | #123 | Excellent 11.8% |
| Fijians | 83.8 /100 | #124 | Excellent 11.8% |
| Sudanese | 83.6 /100 | #125 | Excellent 11.8% |
| Pennsylvania Germans | 83.4 /100 | #126 | Excellent 11.8% |
| Immigrants | Denmark | 82.6 /100 | #127 | Excellent 11.8% |
| Immigrants | Hungary | 81.7 /100 | #128 | Excellent 11.8% |
| Ethiopians | 80.7 /100 | #129 | Excellent 11.8% |
| Spanish | 80.5 /100 | #130 | Excellent 11.8% |
| Immigrants | Western Europe | 79.6 /100 | #131 | Good 11.9% |
| Lebanese | 78.3 /100 | #132 | Good 11.9% |
| Immigrants | Sierra Leone | 77.6 /100 | #133 | Good 11.9% |
| Ugandans | 77.1 /100 | #134 | Good 11.9% |
| Immigrants | Ireland | 76.2 /100 | #135 | Good 11.9% |
| Immigrants | Philippines | 75.0 /100 | #136 | Good 11.9% |
| Immigrants | Moldova | 74.1 /100 | #137 | Good 11.9% |
Demographics Similar to Argentineans by Seniors Poverty Over the Age of 75
In terms of seniors poverty over the age of 75, the demographic groups most similar to Argentineans are Immigrants from Russia (13.4%, a difference of 0.14%), Immigrants from Somalia (13.5%, a difference of 0.24%), Dutch West Indian (13.5%, a difference of 0.26%), Panamanian (13.4%, a difference of 0.31%), and Peruvian (13.4%, a difference of 0.41%).
| Demographics | Rating | Rank | Seniors Poverty Over the Age of 75 |
| Immigrants | Costa Rica | 1.3 /100 | #233 | Tragic 13.3% |
| Immigrants | Israel | 1.1 /100 | #234 | Tragic 13.3% |
| Japanese | 0.9 /100 | #235 | Tragic 13.3% |
| Moroccans | 0.9 /100 | #236 | Tragic 13.3% |
| Alaskan Athabascans | 0.8 /100 | #237 | Tragic 13.4% |
| Peruvians | 0.8 /100 | #238 | Tragic 13.4% |
| Panamanians | 0.8 /100 | #239 | Tragic 13.4% |
| Argentineans | 0.7 /100 | #240 | Tragic 13.4% |
| Immigrants | Russia | 0.6 /100 | #241 | Tragic 13.4% |
| Immigrants | Somalia | 0.6 /100 | #242 | Tragic 13.5% |
| Dutch West Indians | 0.6 /100 | #243 | Tragic 13.5% |
| Spanish Americans | 0.5 /100 | #244 | Tragic 13.5% |
| Uruguayans | 0.5 /100 | #245 | Tragic 13.5% |
| Immigrants | Cambodia | 0.4 /100 | #246 | Tragic 13.6% |
| Immigrants | Ukraine | 0.3 /100 | #247 | Tragic 13.6% |