Spanish American vs Mexican Child Poverty Under the Age of 16
COMPARE
Spanish American
Mexican
Child Poverty Under the Age of 16
Child Poverty Under the Age of 16 Comparison
Spanish Americans
Mexicans
19.2%
CHILD POVERTY UNDER THE AGE OF 16
0.2/ 100
METRIC RATING
258th/ 347
METRIC RANK
20.7%
CHILD POVERTY UNDER THE AGE OF 16
0.0/ 100
METRIC RATING
295th/ 347
METRIC RANK
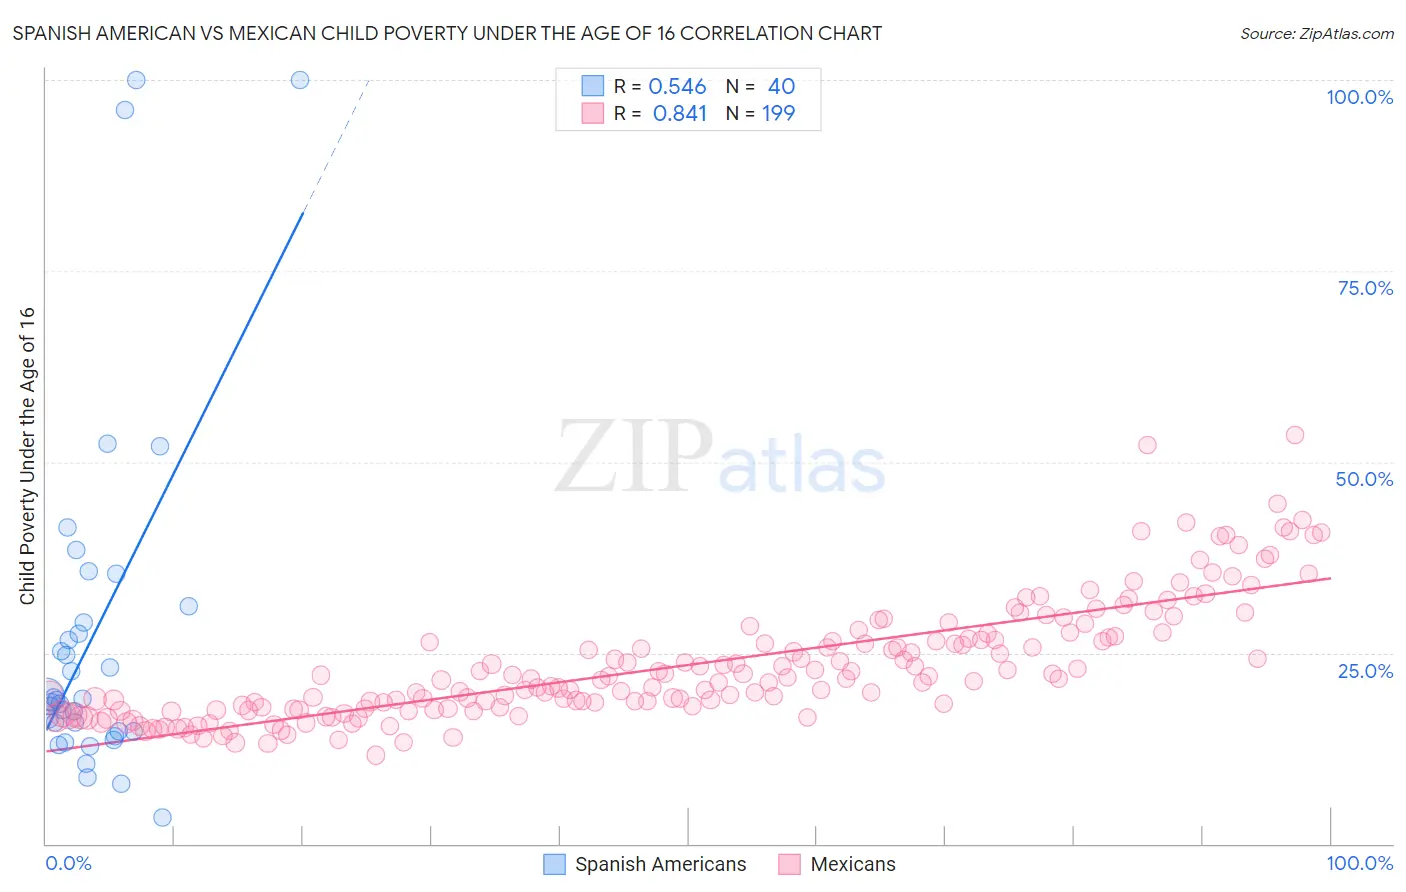
Spanish American vs Mexican Child Poverty Under the Age of 16 Correlation Chart
The statistical analysis conducted on geographies consisting of 102,994,758 people shows a substantial positive correlation between the proportion of Spanish Americans and poverty level among children under the age of 16 in the United States with a correlation coefficient (R) of 0.546 and weighted average of 19.2%. Similarly, the statistical analysis conducted on geographies consisting of 554,745,806 people shows a very strong positive correlation between the proportion of Mexicans and poverty level among children under the age of 16 in the United States with a correlation coefficient (R) of 0.841 and weighted average of 20.7%, a difference of 7.6%.
Child Poverty Under the Age of 16 Correlation Summary
| Measurement | Spanish American | Mexican |
| Minimum | 3.4% | 11.5% |
| Maximum | 100.0% | 53.6% |
| Range | 96.6% | 42.0% |
| Mean | 27.5% | 23.4% |
| Median | 18.9% | 21.4% |
| Interquartile 25% (IQ1) | 14.7% | 17.6% |
| Interquartile 75% (IQ3) | 30.1% | 26.8% |
| Interquartile Range (IQR) | 15.4% | 9.2% |
| Standard Deviation (Sample) | 23.2% | 7.8% |
| Standard Deviation (Population) | 22.9% | 7.7% |
Similar Demographics by Child Poverty Under the Age of 16
Demographics Similar to Spanish Americans by Child Poverty Under the Age of 16
In terms of child poverty under the age of 16, the demographic groups most similar to Spanish Americans are Ottawa (19.2%, a difference of 0.080%), Inupiat (19.2%, a difference of 0.090%), Trinidadian and Tobagonian (19.2%, a difference of 0.18%), Immigrants from Western Africa (19.2%, a difference of 0.35%), and Mexican American Indian (19.3%, a difference of 0.55%).
| Demographics | Rating | Rank | Child Poverty Under the Age of 16 |
| Immigrants | Ghana | 0.3 /100 | #251 | Tragic 19.1% |
| Immigrants | Trinidad and Tobago | 0.3 /100 | #252 | Tragic 19.1% |
| Salvadorans | 0.3 /100 | #253 | Tragic 19.1% |
| Immigrants | Western Africa | 0.2 /100 | #254 | Tragic 19.2% |
| Trinidadians and Tobagonians | 0.2 /100 | #255 | Tragic 19.2% |
| Inupiat | 0.2 /100 | #256 | Tragic 19.2% |
| Ottawa | 0.2 /100 | #257 | Tragic 19.2% |
| Spanish Americans | 0.2 /100 | #258 | Tragic 19.2% |
| Mexican American Indians | 0.2 /100 | #259 | Tragic 19.3% |
| Guyanese | 0.2 /100 | #260 | Tragic 19.3% |
| Immigrants | Burma/Myanmar | 0.1 /100 | #261 | Tragic 19.4% |
| Immigrants | Guyana | 0.1 /100 | #262 | Tragic 19.4% |
| Vietnamese | 0.1 /100 | #263 | Tragic 19.4% |
| Immigrants | Ecuador | 0.1 /100 | #264 | Tragic 19.4% |
| Chickasaw | 0.1 /100 | #265 | Tragic 19.5% |
Demographics Similar to Mexicans by Child Poverty Under the Age of 16
In terms of child poverty under the age of 16, the demographic groups most similar to Mexicans are Haitian (20.7%, a difference of 0.14%), Immigrants from Senegal (20.6%, a difference of 0.34%), Immigrants from Caribbean (20.8%, a difference of 0.38%), Hispanic or Latino (20.8%, a difference of 0.51%), and Arapaho (20.8%, a difference of 0.51%).
| Demographics | Rating | Rank | Child Poverty Under the Age of 16 |
| Immigrants | Belize | 0.0 /100 | #288 | Tragic 20.3% |
| Senegalese | 0.0 /100 | #289 | Tragic 20.4% |
| Yaqui | 0.0 /100 | #290 | Tragic 20.4% |
| Chippewa | 0.0 /100 | #291 | Tragic 20.5% |
| Immigrants | Latin America | 0.0 /100 | #292 | Tragic 20.5% |
| Immigrants | Senegal | 0.0 /100 | #293 | Tragic 20.6% |
| Haitians | 0.0 /100 | #294 | Tragic 20.7% |
| Mexicans | 0.0 /100 | #295 | Tragic 20.7% |
| Immigrants | Caribbean | 0.0 /100 | #296 | Tragic 20.8% |
| Hispanics or Latinos | 0.0 /100 | #297 | Tragic 20.8% |
| Arapaho | 0.0 /100 | #298 | Tragic 20.8% |
| Immigrants | Haiti | 0.0 /100 | #299 | Tragic 20.9% |
| Indonesians | 0.0 /100 | #300 | Tragic 21.0% |
| Immigrants | Grenada | 0.0 /100 | #301 | Tragic 21.0% |
| Immigrants | Bahamas | 0.0 /100 | #302 | Tragic 21.0% |