Spanish American vs Austrian Child Poverty Under the Age of 16
COMPARE
Spanish American
Austrian
Child Poverty Under the Age of 16
Child Poverty Under the Age of 16 Comparison
Spanish Americans
Austrians
19.2%
CHILD POVERTY UNDER THE AGE OF 16
0.2/ 100
METRIC RATING
258th/ 347
METRIC RANK
14.5%
CHILD POVERTY UNDER THE AGE OF 16
96.9/ 100
METRIC RATING
90th/ 347
METRIC RANK
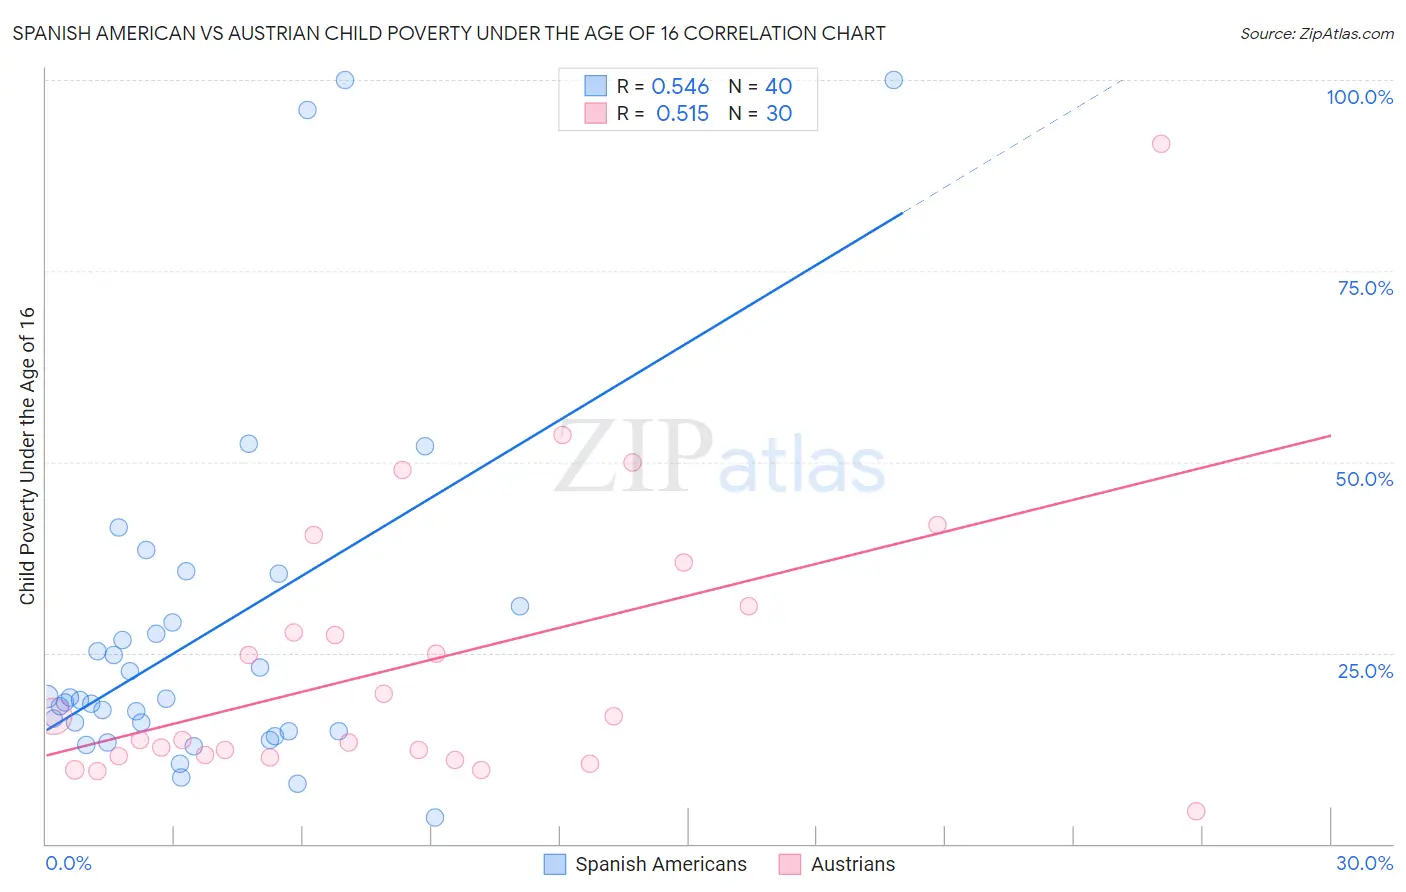
Spanish American vs Austrian Child Poverty Under the Age of 16 Correlation Chart
The statistical analysis conducted on geographies consisting of 102,994,758 people shows a substantial positive correlation between the proportion of Spanish Americans and poverty level among children under the age of 16 in the United States with a correlation coefficient (R) of 0.546 and weighted average of 19.2%. Similarly, the statistical analysis conducted on geographies consisting of 445,410,621 people shows a substantial positive correlation between the proportion of Austrians and poverty level among children under the age of 16 in the United States with a correlation coefficient (R) of 0.515 and weighted average of 14.5%, a difference of 32.2%.
Child Poverty Under the Age of 16 Correlation Summary
| Measurement | Spanish American | Austrian |
| Minimum | 3.4% | 4.3% |
| Maximum | 100.0% | 91.7% |
| Range | 96.6% | 87.4% |
| Mean | 27.5% | 23.9% |
| Median | 18.9% | 15.1% |
| Interquartile 25% (IQ1) | 14.7% | 11.5% |
| Interquartile 75% (IQ3) | 30.1% | 31.1% |
| Interquartile Range (IQR) | 15.4% | 19.6% |
| Standard Deviation (Sample) | 23.2% | 18.8% |
| Standard Deviation (Population) | 22.9% | 18.5% |
Similar Demographics by Child Poverty Under the Age of 16
Demographics Similar to Spanish Americans by Child Poverty Under the Age of 16
In terms of child poverty under the age of 16, the demographic groups most similar to Spanish Americans are Ottawa (19.2%, a difference of 0.080%), Inupiat (19.2%, a difference of 0.090%), Trinidadian and Tobagonian (19.2%, a difference of 0.18%), Immigrants from Western Africa (19.2%, a difference of 0.35%), and Mexican American Indian (19.3%, a difference of 0.55%).
| Demographics | Rating | Rank | Child Poverty Under the Age of 16 |
| Immigrants | Ghana | 0.3 /100 | #251 | Tragic 19.1% |
| Immigrants | Trinidad and Tobago | 0.3 /100 | #252 | Tragic 19.1% |
| Salvadorans | 0.3 /100 | #253 | Tragic 19.1% |
| Immigrants | Western Africa | 0.2 /100 | #254 | Tragic 19.2% |
| Trinidadians and Tobagonians | 0.2 /100 | #255 | Tragic 19.2% |
| Inupiat | 0.2 /100 | #256 | Tragic 19.2% |
| Ottawa | 0.2 /100 | #257 | Tragic 19.2% |
| Spanish Americans | 0.2 /100 | #258 | Tragic 19.2% |
| Mexican American Indians | 0.2 /100 | #259 | Tragic 19.3% |
| Guyanese | 0.2 /100 | #260 | Tragic 19.3% |
| Immigrants | Burma/Myanmar | 0.1 /100 | #261 | Tragic 19.4% |
| Immigrants | Guyana | 0.1 /100 | #262 | Tragic 19.4% |
| Vietnamese | 0.1 /100 | #263 | Tragic 19.4% |
| Immigrants | Ecuador | 0.1 /100 | #264 | Tragic 19.4% |
| Chickasaw | 0.1 /100 | #265 | Tragic 19.5% |
Demographics Similar to Austrians by Child Poverty Under the Age of 16
In terms of child poverty under the age of 16, the demographic groups most similar to Austrians are German (14.5%, a difference of 0.060%), Northern European (14.5%, a difference of 0.12%), Immigrants from North America (14.6%, a difference of 0.18%), Immigrants from Italy (14.6%, a difference of 0.21%), and Immigrants from Argentina (14.5%, a difference of 0.22%).
| Demographics | Rating | Rank | Child Poverty Under the Age of 16 |
| Egyptians | 97.2 /100 | #83 | Exceptional 14.5% |
| Immigrants | Latvia | 97.1 /100 | #84 | Exceptional 14.5% |
| Soviet Union | 97.1 /100 | #85 | Exceptional 14.5% |
| Immigrants | Argentina | 97.1 /100 | #86 | Exceptional 14.5% |
| Taiwanese | 97.1 /100 | #87 | Exceptional 14.5% |
| Northern Europeans | 97.0 /100 | #88 | Exceptional 14.5% |
| Germans | 96.9 /100 | #89 | Exceptional 14.5% |
| Austrians | 96.9 /100 | #90 | Exceptional 14.5% |
| Immigrants | North America | 96.7 /100 | #91 | Exceptional 14.6% |
| Immigrants | Italy | 96.7 /100 | #92 | Exceptional 14.6% |
| Argentineans | 96.6 /100 | #93 | Exceptional 14.6% |
| Immigrants | South Africa | 96.3 /100 | #94 | Exceptional 14.6% |
| Immigrants | Croatia | 96.1 /100 | #95 | Exceptional 14.6% |
| Immigrants | France | 95.8 /100 | #96 | Exceptional 14.7% |
| Paraguayans | 95.7 /100 | #97 | Exceptional 14.7% |