Spanish American vs Immigrants from South Central Asia Child Poverty Among Girls Under 16
COMPARE
Spanish American
Immigrants from South Central Asia
Child Poverty Among Girls Under 16
Child Poverty Among Girls Under 16 Comparison
Spanish Americans
Immigrants from South Central Asia
19.8%
CHILD POVERTY AMONG GIRLS UNDER 16
0.1/ 100
METRIC RATING
266th/ 347
METRIC RANK
12.7%
CHILD POVERTY AMONG GIRLS UNDER 16
100.0/ 100
METRIC RATING
11th/ 347
METRIC RANK
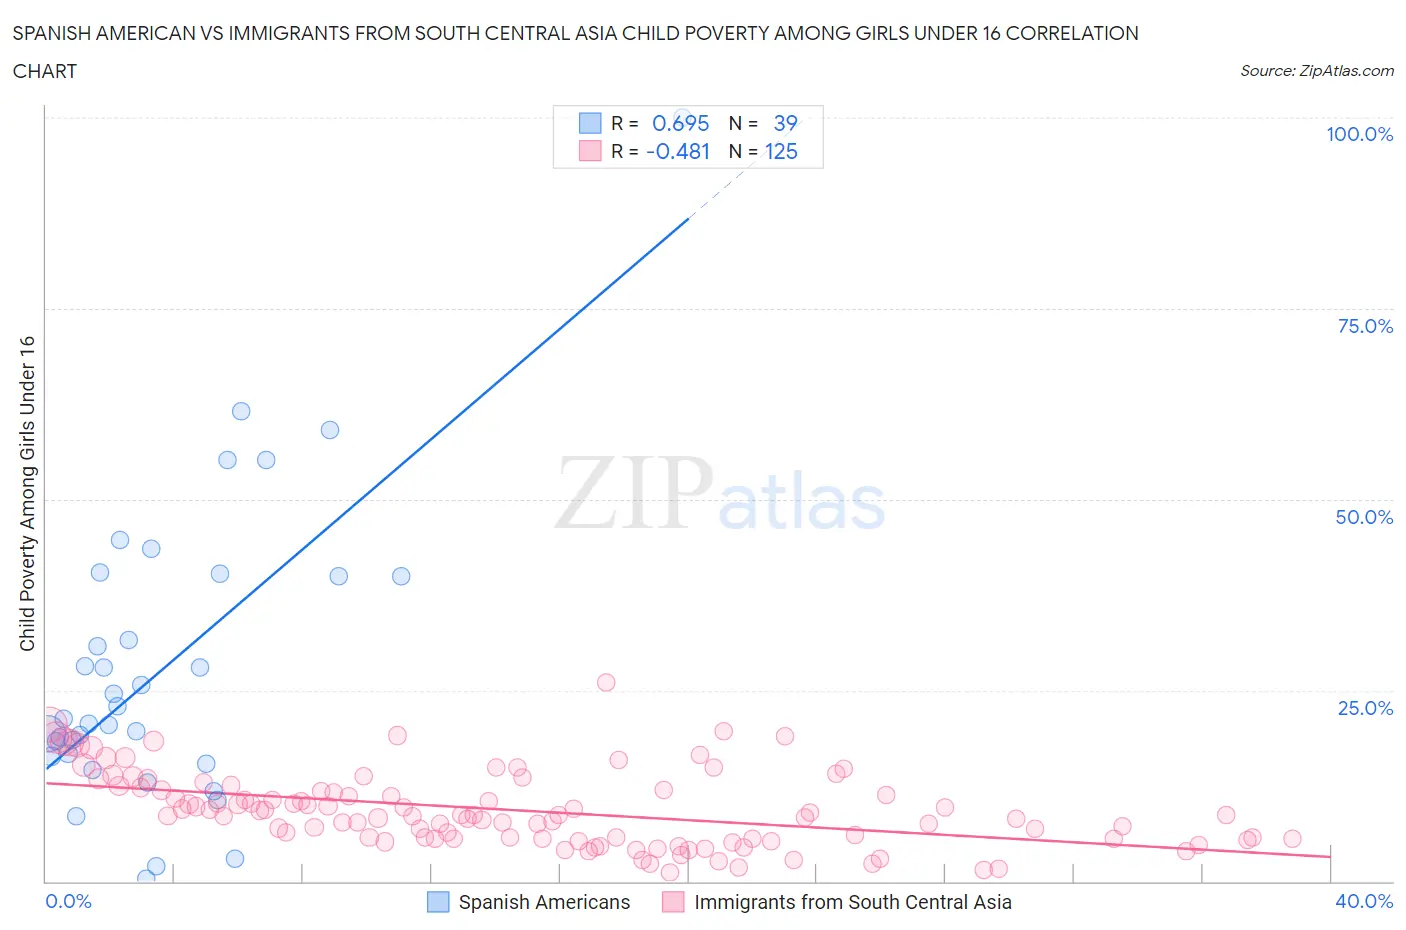
Spanish American vs Immigrants from South Central Asia Child Poverty Among Girls Under 16 Correlation Chart
The statistical analysis conducted on geographies consisting of 102,807,072 people shows a significant positive correlation between the proportion of Spanish Americans and poverty level among girls under the age of 16 in the United States with a correlation coefficient (R) of 0.695 and weighted average of 19.8%. Similarly, the statistical analysis conducted on geographies consisting of 461,235,402 people shows a moderate negative correlation between the proportion of Immigrants from South Central Asia and poverty level among girls under the age of 16 in the United States with a correlation coefficient (R) of -0.481 and weighted average of 12.7%, a difference of 55.5%.
Child Poverty Among Girls Under 16 Correlation Summary
| Measurement | Spanish American | Immigrants from South Central Asia |
| Minimum | 0.37% | 1.2% |
| Maximum | 100.0% | 26.1% |
| Range | 99.6% | 24.8% |
| Mean | 27.9% | 9.3% |
| Median | 21.3% | 8.6% |
| Interquartile 25% (IQ1) | 16.4% | 5.6% |
| Interquartile 75% (IQ3) | 40.0% | 12.1% |
| Interquartile Range (IQR) | 23.6% | 6.5% |
| Standard Deviation (Sample) | 19.5% | 4.8% |
| Standard Deviation (Population) | 19.2% | 4.8% |
Similar Demographics by Child Poverty Among Girls Under 16
Demographics Similar to Spanish Americans by Child Poverty Among Girls Under 16
In terms of child poverty among girls under 16, the demographic groups most similar to Spanish Americans are Immigrants from Bangladesh (19.9%, a difference of 0.22%), Immigrants from Jamaica (19.8%, a difference of 0.25%), Spanish American Indian (19.9%, a difference of 0.26%), Liberian (19.9%, a difference of 0.35%), and Cherokee (19.9%, a difference of 0.54%).
| Demographics | Rating | Rank | Child Poverty Among Girls Under 16 |
| Ottawa | 0.2 /100 | #259 | Tragic 19.4% |
| Mexican American Indians | 0.2 /100 | #260 | Tragic 19.5% |
| Vietnamese | 0.2 /100 | #261 | Tragic 19.5% |
| Chickasaw | 0.1 /100 | #262 | Tragic 19.6% |
| Immigrants | Burma/Myanmar | 0.1 /100 | #263 | Tragic 19.7% |
| Jamaicans | 0.1 /100 | #264 | Tragic 19.7% |
| Immigrants | Jamaica | 0.1 /100 | #265 | Tragic 19.8% |
| Spanish Americans | 0.1 /100 | #266 | Tragic 19.8% |
| Immigrants | Bangladesh | 0.1 /100 | #267 | Tragic 19.9% |
| Spanish American Indians | 0.1 /100 | #268 | Tragic 19.9% |
| Liberians | 0.1 /100 | #269 | Tragic 19.9% |
| Cherokee | 0.1 /100 | #270 | Tragic 19.9% |
| Immigrants | Barbados | 0.1 /100 | #271 | Tragic 19.9% |
| Immigrants | El Salvador | 0.1 /100 | #272 | Tragic 20.0% |
| Bangladeshis | 0.1 /100 | #273 | Tragic 20.0% |
Demographics Similar to Immigrants from South Central Asia by Child Poverty Among Girls Under 16
In terms of child poverty among girls under 16, the demographic groups most similar to Immigrants from South Central Asia are Bhutanese (12.7%, a difference of 0.040%), Immigrants from Ireland (12.9%, a difference of 1.1%), Immigrants from Iran (12.6%, a difference of 1.3%), Burmese (13.0%, a difference of 2.2%), and Okinawan (13.0%, a difference of 2.2%).
| Demographics | Rating | Rank | Child Poverty Among Girls Under 16 |
| Tsimshian | 100.0 /100 | #4 | Exceptional 11.5% |
| Thais | 100.0 /100 | #5 | Exceptional 11.8% |
| Immigrants | Hong Kong | 100.0 /100 | #6 | Exceptional 12.3% |
| Chinese | 100.0 /100 | #7 | Exceptional 12.3% |
| Iranians | 100.0 /100 | #8 | Exceptional 12.4% |
| Immigrants | Singapore | 100.0 /100 | #9 | Exceptional 12.5% |
| Immigrants | Iran | 100.0 /100 | #10 | Exceptional 12.6% |
| Immigrants | South Central Asia | 100.0 /100 | #11 | Exceptional 12.7% |
| Bhutanese | 100.0 /100 | #12 | Exceptional 12.7% |
| Immigrants | Ireland | 99.9 /100 | #13 | Exceptional 12.9% |
| Burmese | 99.9 /100 | #14 | Exceptional 13.0% |
| Okinawans | 99.9 /100 | #15 | Exceptional 13.0% |
| Immigrants | Lithuania | 99.9 /100 | #16 | Exceptional 13.1% |
| Bulgarians | 99.9 /100 | #17 | Exceptional 13.1% |
| Immigrants | Korea | 99.9 /100 | #18 | Exceptional 13.1% |