Spanish American vs Immigrants from Afghanistan Child Poverty Among Boys Under 16
COMPARE
Spanish American
Immigrants from Afghanistan
Child Poverty Among Boys Under 16
Child Poverty Among Boys Under 16 Comparison
Spanish Americans
Immigrants from Afghanistan
19.4%
CHILD POVERTY AMONG BOYS UNDER 16
0.2/ 100
METRIC RATING
259th/ 347
METRIC RANK
17.3%
CHILD POVERTY AMONG BOYS UNDER 16
13.7/ 100
METRIC RATING
201st/ 347
METRIC RANK
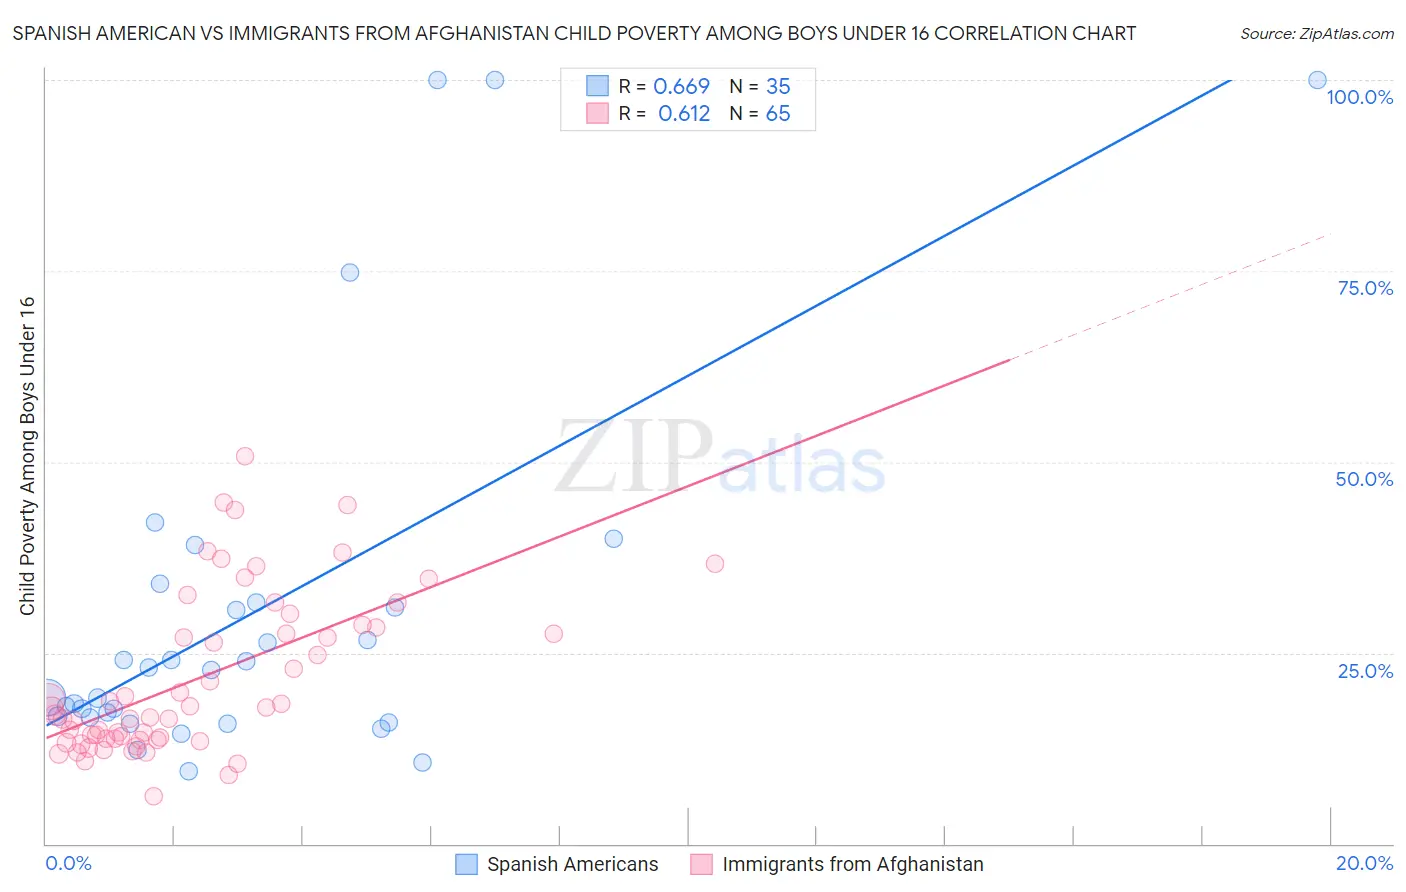
Spanish American vs Immigrants from Afghanistan Child Poverty Among Boys Under 16 Correlation Chart
The statistical analysis conducted on geographies consisting of 102,814,034 people shows a significant positive correlation between the proportion of Spanish Americans and poverty level among boys under the age of 16 in the United States with a correlation coefficient (R) of 0.669 and weighted average of 19.4%. Similarly, the statistical analysis conducted on geographies consisting of 146,910,651 people shows a significant positive correlation between the proportion of Immigrants from Afghanistan and poverty level among boys under the age of 16 in the United States with a correlation coefficient (R) of 0.612 and weighted average of 17.3%, a difference of 12.1%.
Child Poverty Among Boys Under 16 Correlation Summary
| Measurement | Spanish American | Immigrants from Afghanistan |
| Minimum | 9.5% | 6.2% |
| Maximum | 100.0% | 50.7% |
| Range | 90.5% | 44.5% |
| Mean | 30.4% | 21.6% |
| Median | 22.8% | 17.7% |
| Interquartile 25% (IQ1) | 16.5% | 13.6% |
| Interquartile 75% (IQ3) | 31.5% | 28.4% |
| Interquartile Range (IQR) | 15.0% | 14.8% |
| Standard Deviation (Sample) | 24.7% | 10.5% |
| Standard Deviation (Population) | 24.4% | 10.4% |
Similar Demographics by Child Poverty Among Boys Under 16
Demographics Similar to Spanish Americans by Child Poverty Among Boys Under 16
In terms of child poverty among boys under 16, the demographic groups most similar to Spanish Americans are Potawatomi (19.4%, a difference of 0.020%), Mexican American Indian (19.4%, a difference of 0.030%), Shoshone (19.4%, a difference of 0.10%), Immigrants from Ghana (19.4%, a difference of 0.12%), and Immigrants from Liberia (19.3%, a difference of 0.24%).
| Demographics | Rating | Rank | Child Poverty Among Boys Under 16 |
| Immigrants | Western Africa | 0.2 /100 | #252 | Tragic 19.3% |
| Liberians | 0.2 /100 | #253 | Tragic 19.3% |
| Trinidadians and Tobagonians | 0.2 /100 | #254 | Tragic 19.3% |
| Ecuadorians | 0.2 /100 | #255 | Tragic 19.3% |
| Immigrants | Liberia | 0.2 /100 | #256 | Tragic 19.3% |
| Mexican American Indians | 0.2 /100 | #257 | Tragic 19.4% |
| Potawatomi | 0.2 /100 | #258 | Tragic 19.4% |
| Spanish Americans | 0.2 /100 | #259 | Tragic 19.4% |
| Shoshone | 0.2 /100 | #260 | Tragic 19.4% |
| Immigrants | Ghana | 0.2 /100 | #261 | Tragic 19.4% |
| Immigrants | Guyana | 0.1 /100 | #262 | Tragic 19.5% |
| Ottawa | 0.1 /100 | #263 | Tragic 19.5% |
| Iroquois | 0.1 /100 | #264 | Tragic 19.6% |
| Guyanese | 0.1 /100 | #265 | Tragic 19.6% |
| Immigrants | El Salvador | 0.1 /100 | #266 | Tragic 19.6% |
Demographics Similar to Immigrants from Afghanistan by Child Poverty Among Boys Under 16
In terms of child poverty among boys under 16, the demographic groups most similar to Immigrants from Afghanistan are Immigrants from Sierra Leone (17.3%, a difference of 0.060%), Immigrants from Uzbekistan (17.3%, a difference of 0.080%), Ugandan (17.3%, a difference of 0.28%), Immigrants from Portugal (17.4%, a difference of 0.62%), and Immigrants from Uruguay (17.2%, a difference of 0.68%).
| Demographics | Rating | Rank | Child Poverty Among Boys Under 16 |
| Immigrants | Lebanon | 21.2 /100 | #194 | Fair 17.0% |
| Spanish | 20.8 /100 | #195 | Fair 17.0% |
| Spaniards | 20.5 /100 | #196 | Fair 17.1% |
| Immigrants | Kenya | 20.1 /100 | #197 | Fair 17.1% |
| Immigrants | Cameroon | 19.0 /100 | #198 | Poor 17.1% |
| Delaware | 18.8 /100 | #199 | Poor 17.1% |
| Immigrants | Uruguay | 16.9 /100 | #200 | Poor 17.2% |
| Immigrants | Afghanistan | 13.7 /100 | #201 | Poor 17.3% |
| Immigrants | Sierra Leone | 13.4 /100 | #202 | Poor 17.3% |
| Immigrants | Uzbekistan | 13.3 /100 | #203 | Poor 17.3% |
| Ugandans | 12.5 /100 | #204 | Poor 17.3% |
| Immigrants | Portugal | 11.2 /100 | #205 | Poor 17.4% |
| German Russians | 10.9 /100 | #206 | Poor 17.4% |
| Immigrants | Thailand | 8.2 /100 | #207 | Tragic 17.5% |
| Malaysians | 7.6 /100 | #208 | Tragic 17.6% |