Immigrants from Israel vs Immigrants from Afghanistan Child Poverty Among Boys Under 16
COMPARE
Immigrants from Israel
Immigrants from Afghanistan
Child Poverty Among Boys Under 16
Child Poverty Among Boys Under 16 Comparison
Immigrants from Israel
Immigrants from Afghanistan
14.4%
CHILD POVERTY AMONG BOYS UNDER 16
98.7/ 100
METRIC RATING
62nd/ 347
METRIC RANK
17.3%
CHILD POVERTY AMONG BOYS UNDER 16
13.7/ 100
METRIC RATING
201st/ 347
METRIC RANK
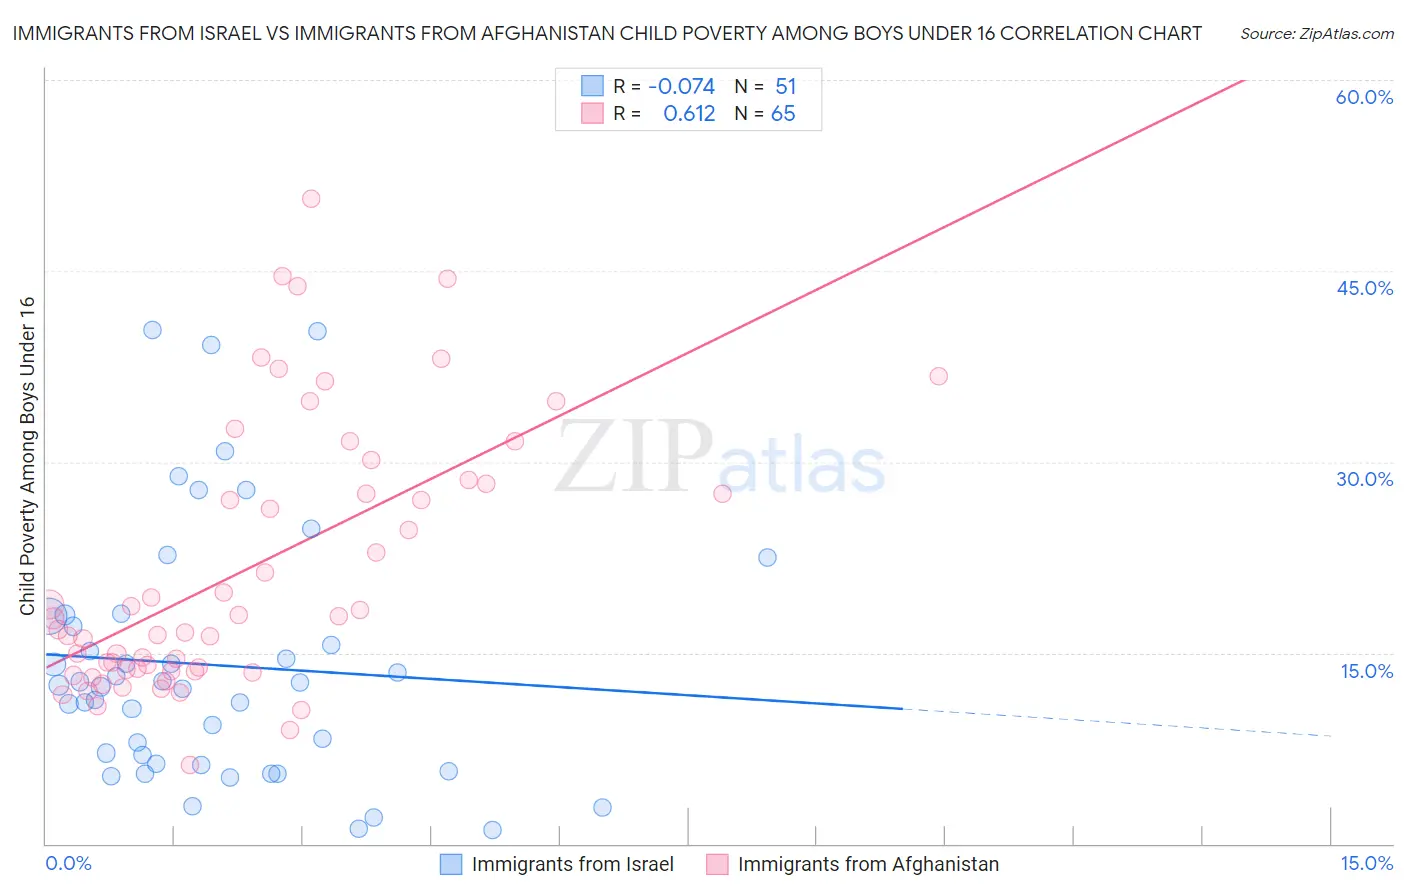
Immigrants from Israel vs Immigrants from Afghanistan Child Poverty Among Boys Under 16 Correlation Chart
The statistical analysis conducted on geographies consisting of 207,231,204 people shows a slight negative correlation between the proportion of Immigrants from Israel and poverty level among boys under the age of 16 in the United States with a correlation coefficient (R) of -0.074 and weighted average of 14.4%. Similarly, the statistical analysis conducted on geographies consisting of 146,910,651 people shows a significant positive correlation between the proportion of Immigrants from Afghanistan and poverty level among boys under the age of 16 in the United States with a correlation coefficient (R) of 0.612 and weighted average of 17.3%, a difference of 19.7%.
Child Poverty Among Boys Under 16 Correlation Summary
| Measurement | Immigrants from Israel | Immigrants from Afghanistan |
| Minimum | 1.1% | 6.2% |
| Maximum | 40.4% | 50.7% |
| Range | 39.3% | 44.5% |
| Mean | 14.0% | 21.6% |
| Median | 12.4% | 17.7% |
| Interquartile 25% (IQ1) | 6.3% | 13.6% |
| Interquartile 75% (IQ3) | 17.8% | 28.4% |
| Interquartile Range (IQR) | 11.6% | 14.8% |
| Standard Deviation (Sample) | 9.8% | 10.5% |
| Standard Deviation (Population) | 9.7% | 10.4% |
Similar Demographics by Child Poverty Among Boys Under 16
Demographics Similar to Immigrants from Israel by Child Poverty Among Boys Under 16
In terms of child poverty among boys under 16, the demographic groups most similar to Immigrants from Israel are Scandinavian (14.4%, a difference of 0.32%), Immigrants from Belgium (14.4%, a difference of 0.44%), Cambodian (14.5%, a difference of 0.44%), Immigrants from Czechoslovakia (14.4%, a difference of 0.46%), and Immigrants from Sweden (14.4%, a difference of 0.48%).
| Demographics | Rating | Rank | Child Poverty Among Boys Under 16 |
| Immigrants | Pakistan | 99.0 /100 | #55 | Exceptional 14.3% |
| Zimbabweans | 99.0 /100 | #56 | Exceptional 14.3% |
| Poles | 98.9 /100 | #57 | Exceptional 14.4% |
| Immigrants | Sweden | 98.9 /100 | #58 | Exceptional 14.4% |
| Immigrants | Czechoslovakia | 98.9 /100 | #59 | Exceptional 14.4% |
| Immigrants | Belgium | 98.9 /100 | #60 | Exceptional 14.4% |
| Scandinavians | 98.8 /100 | #61 | Exceptional 14.4% |
| Immigrants | Israel | 98.7 /100 | #62 | Exceptional 14.4% |
| Cambodians | 98.5 /100 | #63 | Exceptional 14.5% |
| Immigrants | Romania | 98.5 /100 | #64 | Exceptional 14.5% |
| Soviet Union | 98.5 /100 | #65 | Exceptional 14.5% |
| Immigrants | Bulgaria | 98.5 /100 | #66 | Exceptional 14.5% |
| Immigrants | Europe | 98.4 /100 | #67 | Exceptional 14.5% |
| Slovenes | 98.4 /100 | #68 | Exceptional 14.5% |
| Immigrants | Austria | 98.4 /100 | #69 | Exceptional 14.5% |
Demographics Similar to Immigrants from Afghanistan by Child Poverty Among Boys Under 16
In terms of child poverty among boys under 16, the demographic groups most similar to Immigrants from Afghanistan are Immigrants from Sierra Leone (17.3%, a difference of 0.060%), Immigrants from Uzbekistan (17.3%, a difference of 0.080%), Ugandan (17.3%, a difference of 0.28%), Immigrants from Portugal (17.4%, a difference of 0.62%), and Immigrants from Uruguay (17.2%, a difference of 0.68%).
| Demographics | Rating | Rank | Child Poverty Among Boys Under 16 |
| Immigrants | Lebanon | 21.2 /100 | #194 | Fair 17.0% |
| Spanish | 20.8 /100 | #195 | Fair 17.0% |
| Spaniards | 20.5 /100 | #196 | Fair 17.1% |
| Immigrants | Kenya | 20.1 /100 | #197 | Fair 17.1% |
| Immigrants | Cameroon | 19.0 /100 | #198 | Poor 17.1% |
| Delaware | 18.8 /100 | #199 | Poor 17.1% |
| Immigrants | Uruguay | 16.9 /100 | #200 | Poor 17.2% |
| Immigrants | Afghanistan | 13.7 /100 | #201 | Poor 17.3% |
| Immigrants | Sierra Leone | 13.4 /100 | #202 | Poor 17.3% |
| Immigrants | Uzbekistan | 13.3 /100 | #203 | Poor 17.3% |
| Ugandans | 12.5 /100 | #204 | Poor 17.3% |
| Immigrants | Portugal | 11.2 /100 | #205 | Poor 17.4% |
| German Russians | 10.9 /100 | #206 | Poor 17.4% |
| Immigrants | Thailand | 8.2 /100 | #207 | Tragic 17.5% |
| Malaysians | 7.6 /100 | #208 | Tragic 17.6% |