Spanish American vs Argentinean Child Poverty Under the Age of 5
COMPARE
Spanish American
Argentinean
Child Poverty Under the Age of 5
Child Poverty Under the Age of 5 Comparison
Spanish Americans
Argentineans
20.1%
CHILD POVERTY UNDER THE AGE OF 5
0.2/ 100
METRIC RATING
260th/ 347
METRIC RANK
15.4%
CHILD POVERTY UNDER THE AGE OF 5
98.5/ 100
METRIC RATING
74th/ 347
METRIC RANK
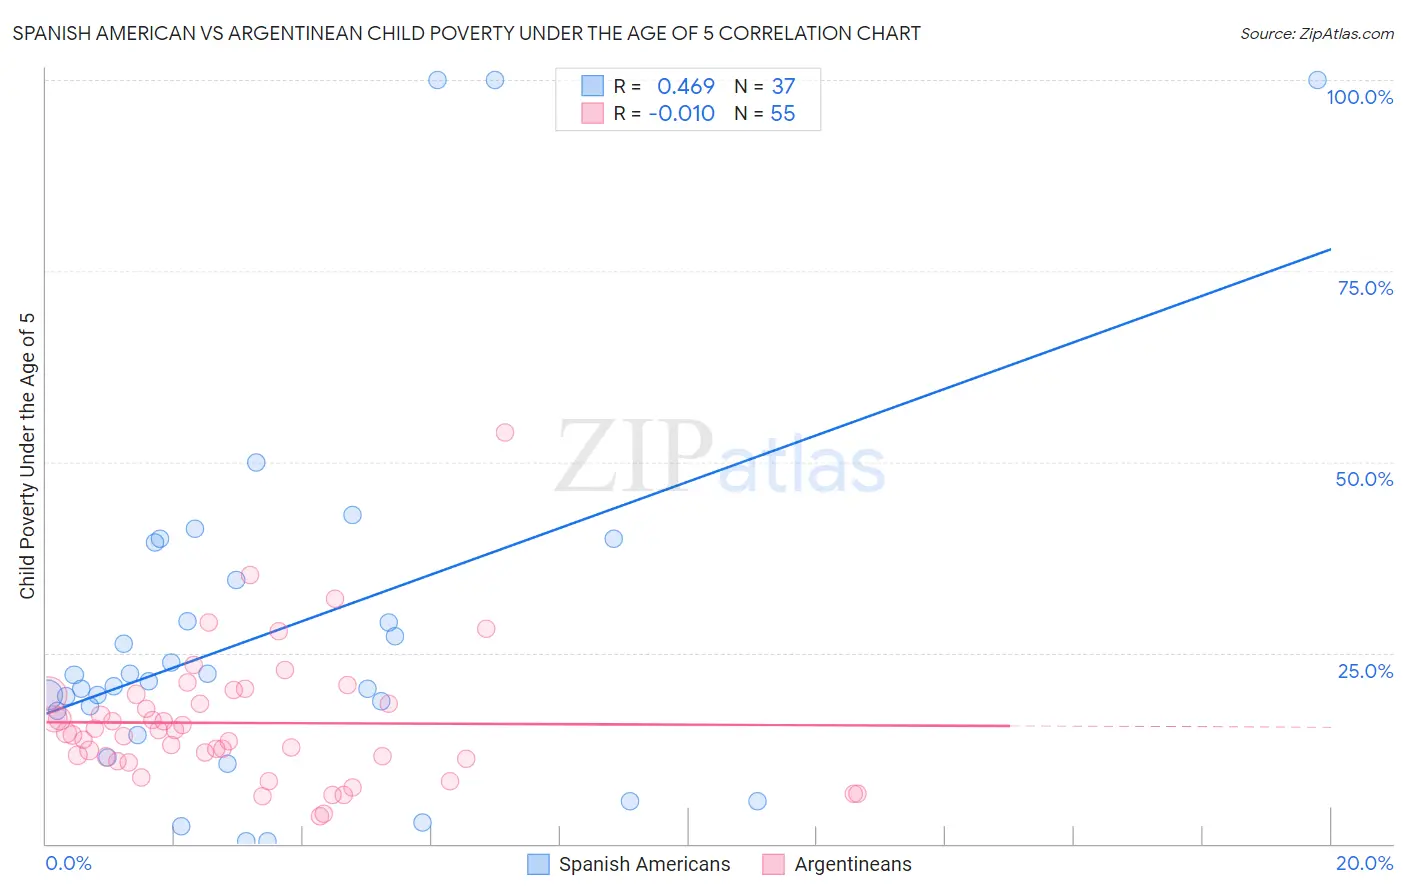
Spanish American vs Argentinean Child Poverty Under the Age of 5 Correlation Chart
The statistical analysis conducted on geographies consisting of 102,323,940 people shows a moderate positive correlation between the proportion of Spanish Americans and poverty level among children under the age of 5 in the United States with a correlation coefficient (R) of 0.469 and weighted average of 20.1%. Similarly, the statistical analysis conducted on geographies consisting of 287,138,695 people shows no correlation between the proportion of Argentineans and poverty level among children under the age of 5 in the United States with a correlation coefficient (R) of -0.010 and weighted average of 15.4%, a difference of 30.8%.
Child Poverty Under the Age of 5 Correlation Summary
| Measurement | Spanish American | Argentinean |
| Minimum | 0.35% | 3.6% |
| Maximum | 100.0% | 53.9% |
| Range | 99.6% | 50.2% |
| Mean | 28.1% | 15.8% |
| Median | 21.3% | 14.5% |
| Interquartile 25% (IQ1) | 15.8% | 11.1% |
| Interquartile 75% (IQ3) | 37.0% | 19.5% |
| Interquartile Range (IQR) | 21.1% | 8.4% |
| Standard Deviation (Sample) | 24.9% | 8.6% |
| Standard Deviation (Population) | 24.6% | 8.5% |
Similar Demographics by Child Poverty Under the Age of 5
Demographics Similar to Spanish Americans by Child Poverty Under the Age of 5
In terms of child poverty under the age of 5, the demographic groups most similar to Spanish Americans are Immigrants from Bangladesh (20.1%, a difference of 0.040%), Immigrants from El Salvador (20.0%, a difference of 0.40%), Immigrants from St. Vincent and the Grenadines (20.0%, a difference of 0.43%), Liberian (20.2%, a difference of 0.45%), and Barbadian (20.2%, a difference of 0.51%).
| Demographics | Rating | Rank | Child Poverty Under the Age of 5 |
| Mexican American Indians | 0.3 /100 | #253 | Tragic 19.9% |
| Fijians | 0.3 /100 | #254 | Tragic 19.9% |
| Immigrants | Cuba | 0.2 /100 | #255 | Tragic 19.9% |
| Immigrants | Barbados | 0.2 /100 | #256 | Tragic 20.0% |
| Shoshone | 0.2 /100 | #257 | Tragic 20.0% |
| Immigrants | St. Vincent and the Grenadines | 0.2 /100 | #258 | Tragic 20.0% |
| Immigrants | El Salvador | 0.2 /100 | #259 | Tragic 20.0% |
| Spanish Americans | 0.2 /100 | #260 | Tragic 20.1% |
| Immigrants | Bangladesh | 0.2 /100 | #261 | Tragic 20.1% |
| Liberians | 0.1 /100 | #262 | Tragic 20.2% |
| Barbadians | 0.1 /100 | #263 | Tragic 20.2% |
| Immigrants | Liberia | 0.1 /100 | #264 | Tragic 20.2% |
| Spanish American Indians | 0.1 /100 | #265 | Tragic 20.2% |
| Aleuts | 0.1 /100 | #266 | Tragic 20.3% |
| Ottawa | 0.1 /100 | #267 | Tragic 20.3% |
Demographics Similar to Argentineans by Child Poverty Under the Age of 5
In terms of child poverty under the age of 5, the demographic groups most similar to Argentineans are Immigrants from Argentina (15.4%, a difference of 0.15%), Croatian (15.4%, a difference of 0.15%), Immigrants from Ukraine (15.3%, a difference of 0.36%), Immigrants from Turkey (15.4%, a difference of 0.36%), and Immigrants from Sweden (15.3%, a difference of 0.59%).
| Demographics | Rating | Rank | Child Poverty Under the Age of 5 |
| Greeks | 99.0 /100 | #67 | Exceptional 15.2% |
| Zimbabweans | 99.0 /100 | #68 | Exceptional 15.2% |
| Lithuanians | 99.0 /100 | #69 | Exceptional 15.2% |
| Immigrants | Belgium | 98.8 /100 | #70 | Exceptional 15.3% |
| Immigrants | Egypt | 98.8 /100 | #71 | Exceptional 15.3% |
| Immigrants | Sweden | 98.8 /100 | #72 | Exceptional 15.3% |
| Immigrants | Ukraine | 98.7 /100 | #73 | Exceptional 15.3% |
| Argentineans | 98.5 /100 | #74 | Exceptional 15.4% |
| Immigrants | Argentina | 98.5 /100 | #75 | Exceptional 15.4% |
| Croatians | 98.5 /100 | #76 | Exceptional 15.4% |
| Immigrants | Turkey | 98.3 /100 | #77 | Exceptional 15.4% |
| Sri Lankans | 98.1 /100 | #78 | Exceptional 15.5% |
| Australians | 98.0 /100 | #79 | Exceptional 15.5% |
| Italians | 97.9 /100 | #80 | Exceptional 15.5% |
| Czechs | 97.8 /100 | #81 | Exceptional 15.5% |