Immigrants from Sudan vs Argentinean Child Poverty Under the Age of 5
COMPARE
Immigrants from Sudan
Argentinean
Child Poverty Under the Age of 5
Child Poverty Under the Age of 5 Comparison
Immigrants from Sudan
Argentineans
19.2%
CHILD POVERTY UNDER THE AGE OF 5
1.3/ 100
METRIC RATING
228th/ 347
METRIC RANK
15.4%
CHILD POVERTY UNDER THE AGE OF 5
98.5/ 100
METRIC RATING
74th/ 347
METRIC RANK
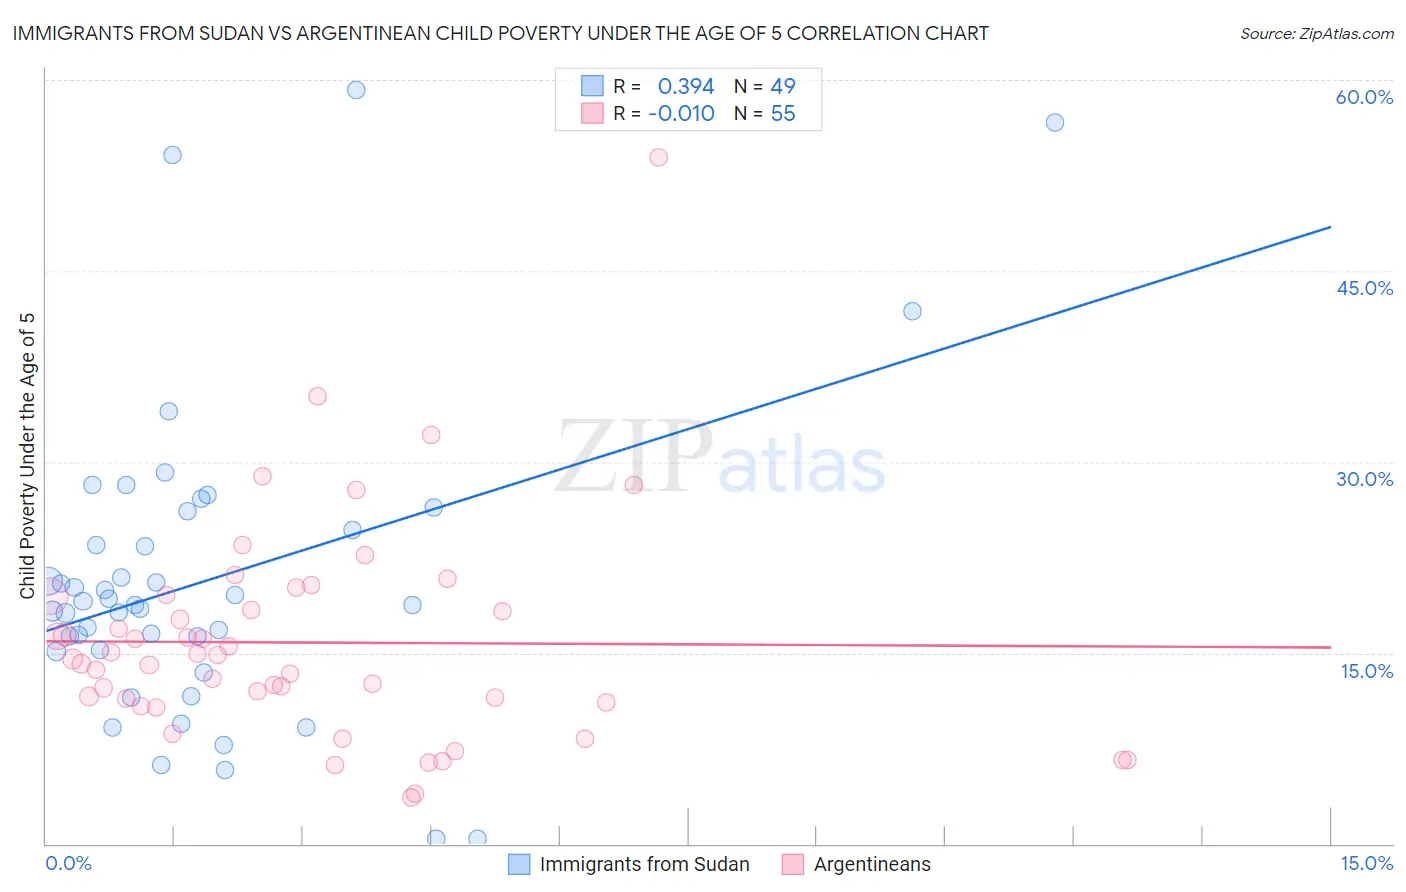
Immigrants from Sudan vs Argentinean Child Poverty Under the Age of 5 Correlation Chart
The statistical analysis conducted on geographies consisting of 117,972,836 people shows a mild positive correlation between the proportion of Immigrants from Sudan and poverty level among children under the age of 5 in the United States with a correlation coefficient (R) of 0.394 and weighted average of 19.2%. Similarly, the statistical analysis conducted on geographies consisting of 287,138,695 people shows no correlation between the proportion of Argentineans and poverty level among children under the age of 5 in the United States with a correlation coefficient (R) of -0.010 and weighted average of 15.4%, a difference of 24.9%.
Child Poverty Under the Age of 5 Correlation Summary
| Measurement | Immigrants from Sudan | Argentinean |
| Minimum | 0.35% | 3.6% |
| Maximum | 59.2% | 53.9% |
| Range | 58.9% | 50.2% |
| Mean | 20.7% | 15.8% |
| Median | 18.8% | 14.5% |
| Interquartile 25% (IQ1) | 15.2% | 11.1% |
| Interquartile 75% (IQ3) | 25.4% | 19.5% |
| Interquartile Range (IQR) | 10.2% | 8.4% |
| Standard Deviation (Sample) | 12.2% | 8.6% |
| Standard Deviation (Population) | 12.1% | 8.5% |
Similar Demographics by Child Poverty Under the Age of 5
Demographics Similar to Immigrants from Sudan by Child Poverty Under the Age of 5
In terms of child poverty under the age of 5, the demographic groups most similar to Immigrants from Sudan are Ghanaian (19.2%, a difference of 0.080%), Ecuadorian (19.2%, a difference of 0.12%), Bermudan (19.2%, a difference of 0.17%), Cape Verdean (19.1%, a difference of 0.30%), and Immigrants from Eritrea (19.1%, a difference of 0.49%).
| Demographics | Rating | Rank | Child Poverty Under the Age of 5 |
| Immigrants | Nigeria | 2.1 /100 | #221 | Tragic 19.0% |
| Alsatians | 1.7 /100 | #222 | Tragic 19.1% |
| Cubans | 1.7 /100 | #223 | Tragic 19.1% |
| Nicaraguans | 1.6 /100 | #224 | Tragic 19.1% |
| Nigerians | 1.6 /100 | #225 | Tragic 19.1% |
| Immigrants | Eritrea | 1.5 /100 | #226 | Tragic 19.1% |
| Cape Verdeans | 1.4 /100 | #227 | Tragic 19.1% |
| Immigrants | Sudan | 1.3 /100 | #228 | Tragic 19.2% |
| Ghanaians | 1.2 /100 | #229 | Tragic 19.2% |
| Ecuadorians | 1.2 /100 | #230 | Tragic 19.2% |
| Bermudans | 1.2 /100 | #231 | Tragic 19.2% |
| Trinidadians and Tobagonians | 0.9 /100 | #232 | Tragic 19.3% |
| Sudanese | 0.9 /100 | #233 | Tragic 19.3% |
| Immigrants | Micronesia | 0.9 /100 | #234 | Tragic 19.4% |
| Immigrants | Laos | 0.8 /100 | #235 | Tragic 19.4% |
Demographics Similar to Argentineans by Child Poverty Under the Age of 5
In terms of child poverty under the age of 5, the demographic groups most similar to Argentineans are Immigrants from Argentina (15.4%, a difference of 0.15%), Croatian (15.4%, a difference of 0.15%), Immigrants from Ukraine (15.3%, a difference of 0.36%), Immigrants from Turkey (15.4%, a difference of 0.36%), and Immigrants from Sweden (15.3%, a difference of 0.59%).
| Demographics | Rating | Rank | Child Poverty Under the Age of 5 |
| Greeks | 99.0 /100 | #67 | Exceptional 15.2% |
| Zimbabweans | 99.0 /100 | #68 | Exceptional 15.2% |
| Lithuanians | 99.0 /100 | #69 | Exceptional 15.2% |
| Immigrants | Belgium | 98.8 /100 | #70 | Exceptional 15.3% |
| Immigrants | Egypt | 98.8 /100 | #71 | Exceptional 15.3% |
| Immigrants | Sweden | 98.8 /100 | #72 | Exceptional 15.3% |
| Immigrants | Ukraine | 98.7 /100 | #73 | Exceptional 15.3% |
| Argentineans | 98.5 /100 | #74 | Exceptional 15.4% |
| Immigrants | Argentina | 98.5 /100 | #75 | Exceptional 15.4% |
| Croatians | 98.5 /100 | #76 | Exceptional 15.4% |
| Immigrants | Turkey | 98.3 /100 | #77 | Exceptional 15.4% |
| Sri Lankans | 98.1 /100 | #78 | Exceptional 15.5% |
| Australians | 98.0 /100 | #79 | Exceptional 15.5% |
| Italians | 97.9 /100 | #80 | Exceptional 15.5% |
| Czechs | 97.8 /100 | #81 | Exceptional 15.5% |