Spaniard vs Bulgarian Poverty
COMPARE
Spaniard
Bulgarian
Poverty
Poverty Comparison
Spaniards
Bulgarians
12.8%
POVERTY
16.5/ 100
METRIC RATING
200th/ 347
METRIC RANK
10.2%
POVERTY
99.9/ 100
METRIC RATING
10th/ 347
METRIC RANK
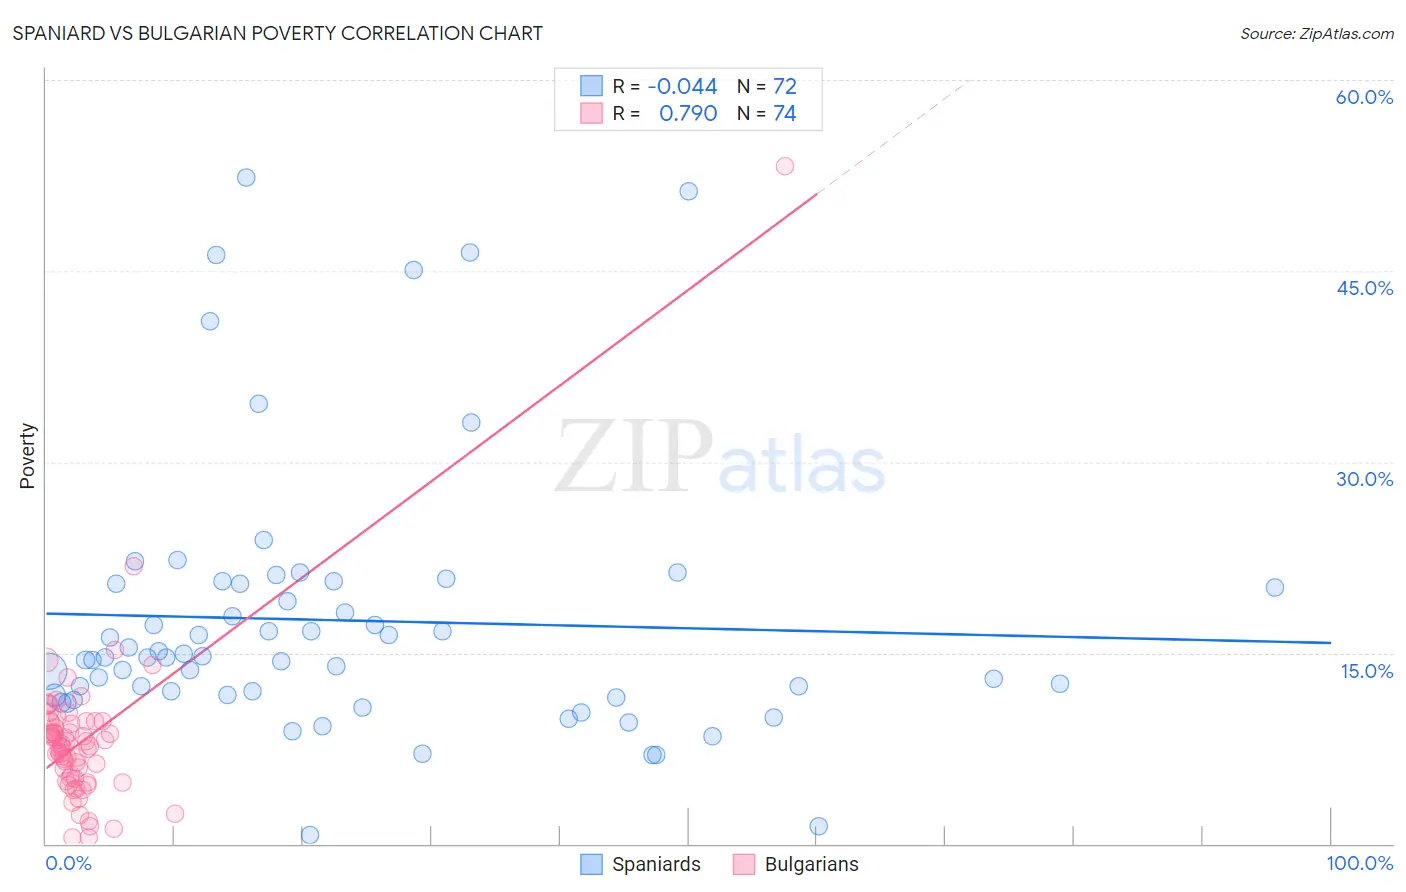
Spaniard vs Bulgarian Poverty Correlation Chart
The statistical analysis conducted on geographies consisting of 443,194,534 people shows no correlation between the proportion of Spaniards and poverty level in the United States with a correlation coefficient (R) of -0.044 and weighted average of 12.8%. Similarly, the statistical analysis conducted on geographies consisting of 205,564,290 people shows a strong positive correlation between the proportion of Bulgarians and poverty level in the United States with a correlation coefficient (R) of 0.790 and weighted average of 10.2%, a difference of 24.9%.
Poverty Correlation Summary
| Measurement | Spaniard | Bulgarian |
| Minimum | 0.64% | 0.47% |
| Maximum | 52.4% | 53.2% |
| Range | 51.7% | 52.7% |
| Mean | 17.5% | 8.2% |
| Median | 14.7% | 7.8% |
| Interquartile 25% (IQ1) | 11.7% | 5.2% |
| Interquartile 75% (IQ3) | 20.5% | 9.5% |
| Interquartile Range (IQR) | 8.8% | 4.3% |
| Standard Deviation (Sample) | 10.6% | 6.4% |
| Standard Deviation (Population) | 10.5% | 6.3% |
Similar Demographics by Poverty
Demographics Similar to Spaniards by Poverty
In terms of poverty, the demographic groups most similar to Spaniards are Immigrants from Uganda (12.8%, a difference of 0.0%), Immigrants from Kenya (12.8%, a difference of 0.16%), Immigrants from Uruguay (12.8%, a difference of 0.16%), Hmong (12.8%, a difference of 0.27%), and Immigrants from Lebanon (12.8%, a difference of 0.35%).
| Demographics | Rating | Rank | Poverty |
| Delaware | 21.4 /100 | #193 | Fair 12.7% |
| Arabs | 21.1 /100 | #194 | Fair 12.7% |
| Immigrants | Kuwait | 20.9 /100 | #195 | Fair 12.7% |
| Iraqis | 20.8 /100 | #196 | Fair 12.7% |
| Immigrants | Lebanon | 18.7 /100 | #197 | Poor 12.8% |
| Spanish | 18.7 /100 | #198 | Poor 12.8% |
| Immigrants | Kenya | 17.5 /100 | #199 | Poor 12.8% |
| Spaniards | 16.5 /100 | #200 | Poor 12.8% |
| Immigrants | Uganda | 16.5 /100 | #201 | Poor 12.8% |
| Immigrants | Uruguay | 15.6 /100 | #202 | Poor 12.8% |
| Hmong | 15.0 /100 | #203 | Poor 12.8% |
| Immigrants | Western Asia | 14.1 /100 | #204 | Poor 12.9% |
| Tsimshian | 9.2 /100 | #205 | Tragic 13.0% |
| Immigrants | Eastern Africa | 7.0 /100 | #206 | Tragic 13.1% |
| Panamanians | 6.6 /100 | #207 | Tragic 13.1% |
Demographics Similar to Bulgarians by Poverty
In terms of poverty, the demographic groups most similar to Bulgarians are Immigrants from South Central Asia (10.2%, a difference of 0.41%), Maltese (10.2%, a difference of 0.86%), Immigrants from Lithuania (10.3%, a difference of 0.99%), Filipino (10.1%, a difference of 1.3%), and Bhutanese (10.4%, a difference of 1.3%).
| Demographics | Rating | Rank | Poverty |
| Thais | 100.0 /100 | #3 | Exceptional 9.6% |
| Immigrants | Taiwan | 100.0 /100 | #4 | Exceptional 9.7% |
| Immigrants | Ireland | 99.9 /100 | #5 | Exceptional 10.1% |
| Assyrians/Chaldeans/Syriacs | 99.9 /100 | #6 | Exceptional 10.1% |
| Filipinos | 99.9 /100 | #7 | Exceptional 10.1% |
| Maltese | 99.9 /100 | #8 | Exceptional 10.2% |
| Immigrants | South Central Asia | 99.9 /100 | #9 | Exceptional 10.2% |
| Bulgarians | 99.9 /100 | #10 | Exceptional 10.2% |
| Immigrants | Lithuania | 99.9 /100 | #11 | Exceptional 10.3% |
| Bhutanese | 99.8 /100 | #12 | Exceptional 10.4% |
| Immigrants | Hong Kong | 99.8 /100 | #13 | Exceptional 10.4% |
| Immigrants | Bolivia | 99.8 /100 | #14 | Exceptional 10.4% |
| Bolivians | 99.8 /100 | #15 | Exceptional 10.4% |
| Lithuanians | 99.8 /100 | #16 | Exceptional 10.5% |
| Norwegians | 99.8 /100 | #17 | Exceptional 10.5% |