Soviet Union vs Immigrants from Burma/Myanmar Female Poverty Among 18-24 Year Olds
COMPARE
Soviet Union
Immigrants from Burma/Myanmar
Female Poverty Among 18-24 Year Olds
Female Poverty Among 18-24 Year Olds Comparison
Soviet Union
Immigrants from Burma/Myanmar
19.5%
FEMALE POVERTY AMONG 18-24 YEAR OLDS
92.0/ 100
METRIC RATING
135th/ 347
METRIC RANK
21.6%
FEMALE POVERTY AMONG 18-24 YEAR OLDS
0.2/ 100
METRIC RATING
268th/ 347
METRIC RANK
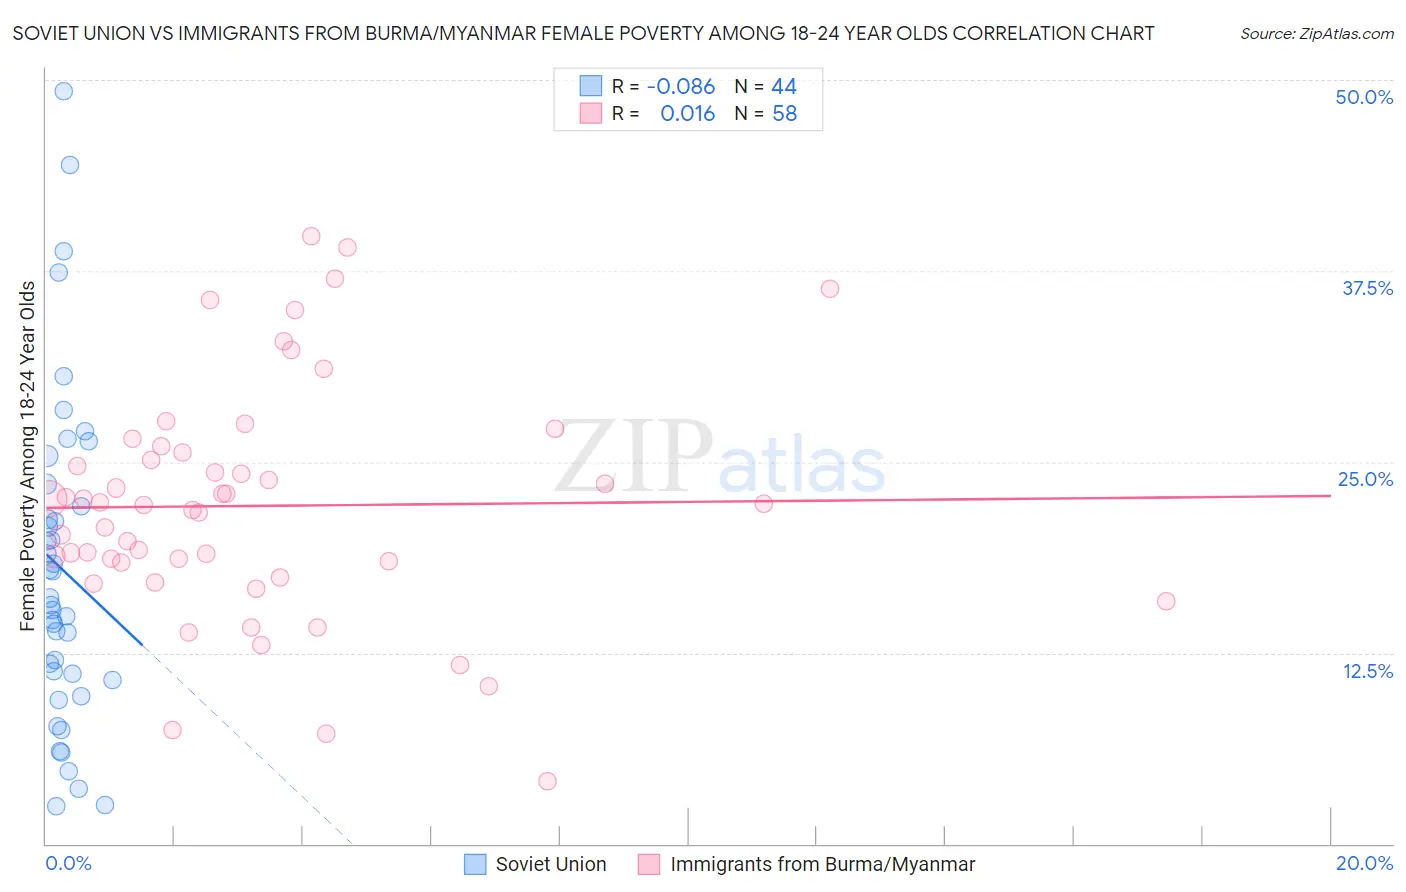
Soviet Union vs Immigrants from Burma/Myanmar Female Poverty Among 18-24 Year Olds Correlation Chart
The statistical analysis conducted on geographies consisting of 43,300,584 people shows a slight negative correlation between the proportion of Soviet Union and poverty level among females between the ages 18 and 24 in the United States with a correlation coefficient (R) of -0.086 and weighted average of 19.5%. Similarly, the statistical analysis conducted on geographies consisting of 170,928,474 people shows no correlation between the proportion of Immigrants from Burma/Myanmar and poverty level among females between the ages 18 and 24 in the United States with a correlation coefficient (R) of 0.016 and weighted average of 21.6%, a difference of 10.7%.
Female Poverty Among 18-24 Year Olds Correlation Summary
| Measurement | Soviet Union | Immigrants from Burma/Myanmar |
| Minimum | 2.4% | 4.1% |
| Maximum | 49.3% | 39.8% |
| Range | 46.8% | 35.7% |
| Mean | 18.0% | 22.1% |
| Median | 15.9% | 22.2% |
| Interquartile 25% (IQ1) | 10.9% | 18.4% |
| Interquartile 75% (IQ3) | 22.8% | 25.6% |
| Interquartile Range (IQR) | 11.9% | 7.2% |
| Standard Deviation (Sample) | 10.7% | 7.7% |
| Standard Deviation (Population) | 10.6% | 7.6% |
Similar Demographics by Female Poverty Among 18-24 Year Olds
Demographics Similar to Soviet Union by Female Poverty Among 18-24 Year Olds
In terms of female poverty among 18-24 year olds, the demographic groups most similar to Soviet Union are Immigrants from North America (19.5%, a difference of 0.010%), Jamaican (19.5%, a difference of 0.020%), Turkish (19.5%, a difference of 0.020%), Russian (19.5%, a difference of 0.090%), and Latvian (19.5%, a difference of 0.12%).
| Demographics | Rating | Rank | Female Poverty Among 18-24 Year Olds |
| Slovaks | 92.9 /100 | #128 | Exceptional 19.5% |
| Immigrants | England | 92.9 /100 | #129 | Exceptional 19.5% |
| Immigrants | Canada | 92.9 /100 | #130 | Exceptional 19.5% |
| Latvians | 92.7 /100 | #131 | Exceptional 19.5% |
| Jamaicans | 92.1 /100 | #132 | Exceptional 19.5% |
| Turks | 92.1 /100 | #133 | Exceptional 19.5% |
| Immigrants | North America | 92.1 /100 | #134 | Exceptional 19.5% |
| Soviet Union | 92.0 /100 | #135 | Exceptional 19.5% |
| Russians | 91.5 /100 | #136 | Exceptional 19.5% |
| Austrians | 90.7 /100 | #137 | Exceptional 19.5% |
| Immigrants | Morocco | 89.9 /100 | #138 | Excellent 19.6% |
| Indians (Asian) | 88.3 /100 | #139 | Excellent 19.6% |
| Immigrants | Trinidad and Tobago | 85.6 /100 | #140 | Excellent 19.7% |
| Pennsylvania Germans | 85.5 /100 | #141 | Excellent 19.7% |
| Panamanians | 84.6 /100 | #142 | Excellent 19.7% |
Demographics Similar to Immigrants from Burma/Myanmar by Female Poverty Among 18-24 Year Olds
In terms of female poverty among 18-24 year olds, the demographic groups most similar to Immigrants from Burma/Myanmar are Celtic (21.6%, a difference of 0.060%), Mongolian (21.6%, a difference of 0.090%), Scotch-Irish (21.6%, a difference of 0.10%), American (21.6%, a difference of 0.15%), and Alaska Native (21.5%, a difference of 0.23%).
| Demographics | Rating | Rank | Female Poverty Among 18-24 Year Olds |
| Immigrants | Bahamas | 0.5 /100 | #261 | Tragic 21.4% |
| Immigrants | Eastern Africa | 0.4 /100 | #262 | Tragic 21.4% |
| Icelanders | 0.3 /100 | #263 | Tragic 21.5% |
| Hondurans | 0.3 /100 | #264 | Tragic 21.5% |
| Immigrants | Nonimmigrants | 0.3 /100 | #265 | Tragic 21.5% |
| Alaska Natives | 0.3 /100 | #266 | Tragic 21.5% |
| Americans | 0.3 /100 | #267 | Tragic 21.6% |
| Immigrants | Burma/Myanmar | 0.2 /100 | #268 | Tragic 21.6% |
| Celtics | 0.2 /100 | #269 | Tragic 21.6% |
| Mongolians | 0.2 /100 | #270 | Tragic 21.6% |
| Scotch-Irish | 0.2 /100 | #271 | Tragic 21.6% |
| Basques | 0.2 /100 | #272 | Tragic 21.7% |
| New Zealanders | 0.2 /100 | #273 | Tragic 21.7% |
| Immigrants | Honduras | 0.1 /100 | #274 | Tragic 21.8% |
| Immigrants | Bangladesh | 0.1 /100 | #275 | Tragic 21.8% |