Soviet Union vs Immigrants from Austria Female Poverty Among 18-24 Year Olds
COMPARE
Soviet Union
Immigrants from Austria
Female Poverty Among 18-24 Year Olds
Female Poverty Among 18-24 Year Olds Comparison
Soviet Union
Immigrants from Austria
19.5%
FEMALE POVERTY AMONG 18-24 YEAR OLDS
92.0/ 100
METRIC RATING
135th/ 347
METRIC RANK
19.7%
FEMALE POVERTY AMONG 18-24 YEAR OLDS
83.1/ 100
METRIC RATING
147th/ 347
METRIC RANK
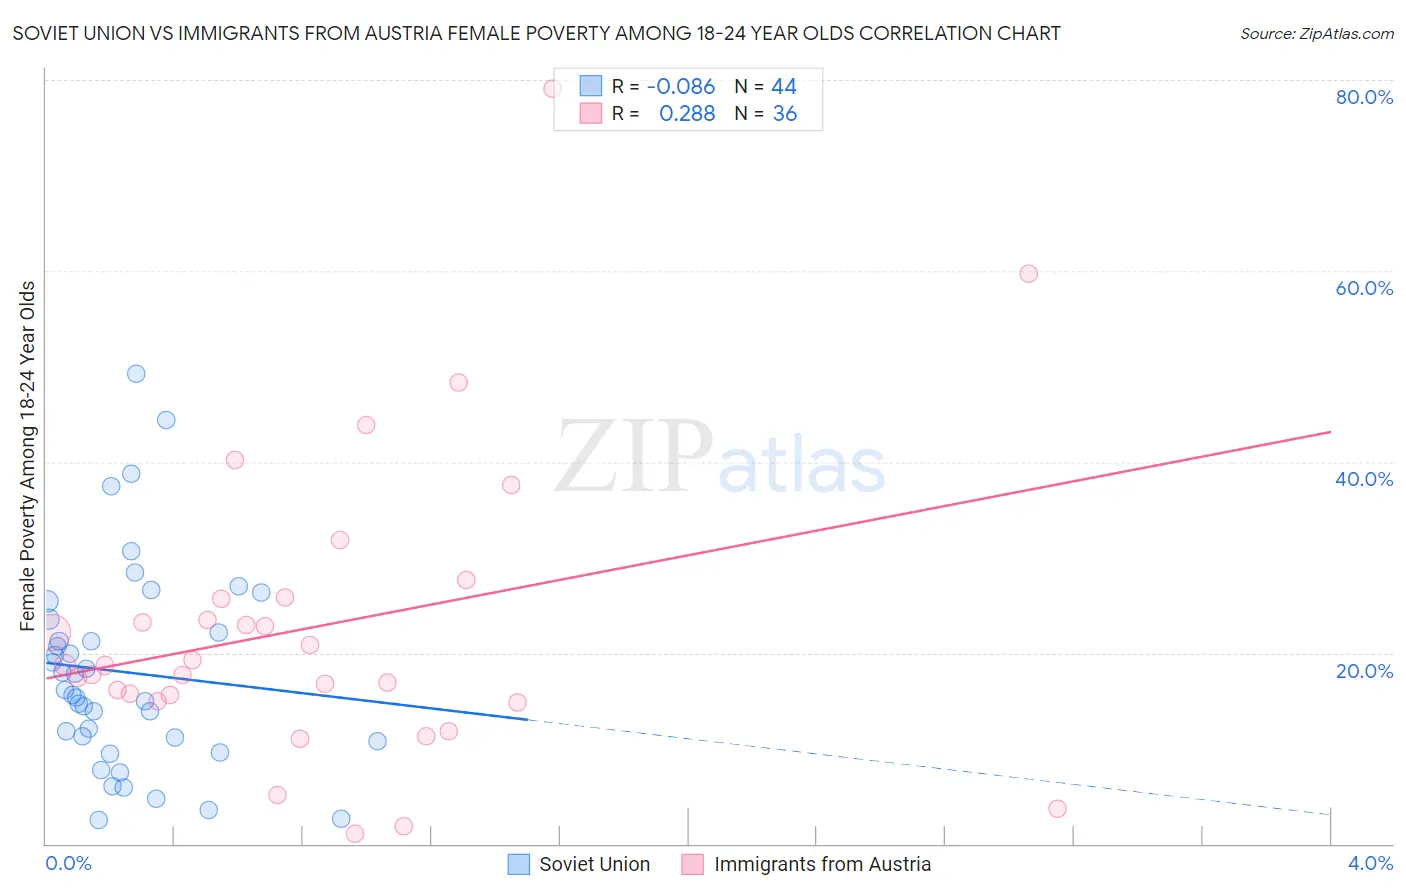
Soviet Union vs Immigrants from Austria Female Poverty Among 18-24 Year Olds Correlation Chart
The statistical analysis conducted on geographies consisting of 43,300,584 people shows a slight negative correlation between the proportion of Soviet Union and poverty level among females between the ages 18 and 24 in the United States with a correlation coefficient (R) of -0.086 and weighted average of 19.5%. Similarly, the statistical analysis conducted on geographies consisting of 165,272,500 people shows a weak positive correlation between the proportion of Immigrants from Austria and poverty level among females between the ages 18 and 24 in the United States with a correlation coefficient (R) of 0.288 and weighted average of 19.7%, a difference of 1.1%.
Female Poverty Among 18-24 Year Olds Correlation Summary
| Measurement | Soviet Union | Immigrants from Austria |
| Minimum | 2.4% | 1.0% |
| Maximum | 49.3% | 79.1% |
| Range | 46.8% | 78.0% |
| Mean | 18.0% | 22.8% |
| Median | 15.9% | 18.7% |
| Interquartile 25% (IQ1) | 10.9% | 15.3% |
| Interquartile 75% (IQ3) | 22.8% | 25.7% |
| Interquartile Range (IQR) | 11.9% | 10.4% |
| Standard Deviation (Sample) | 10.7% | 15.8% |
| Standard Deviation (Population) | 10.6% | 15.6% |
Demographics Similar to Soviet Union and Immigrants from Austria by Female Poverty Among 18-24 Year Olds
In terms of female poverty among 18-24 year olds, the demographic groups most similar to Soviet Union are Immigrants from North America (19.5%, a difference of 0.010%), Jamaican (19.5%, a difference of 0.020%), Turkish (19.5%, a difference of 0.020%), Russian (19.5%, a difference of 0.090%), and Latvian (19.5%, a difference of 0.12%). Similarly, the demographic groups most similar to Immigrants from Austria are Immigrants from Bosnia and Herzegovina (19.7%, a difference of 0.050%), Canadian (19.7%, a difference of 0.060%), Immigrants from Northern Africa (19.7%, a difference of 0.090%), Slavic (19.7%, a difference of 0.12%), and Panamanian (19.7%, a difference of 0.13%).
| Demographics | Rating | Rank | Female Poverty Among 18-24 Year Olds |
| Latvians | 92.7 /100 | #131 | Exceptional 19.5% |
| Jamaicans | 92.1 /100 | #132 | Exceptional 19.5% |
| Turks | 92.1 /100 | #133 | Exceptional 19.5% |
| Immigrants | North America | 92.1 /100 | #134 | Exceptional 19.5% |
| Soviet Union | 92.0 /100 | #135 | Exceptional 19.5% |
| Russians | 91.5 /100 | #136 | Exceptional 19.5% |
| Austrians | 90.7 /100 | #137 | Exceptional 19.5% |
| Immigrants | Morocco | 89.9 /100 | #138 | Excellent 19.6% |
| Indians (Asian) | 88.3 /100 | #139 | Excellent 19.6% |
| Immigrants | Trinidad and Tobago | 85.6 /100 | #140 | Excellent 19.7% |
| Pennsylvania Germans | 85.5 /100 | #141 | Excellent 19.7% |
| Panamanians | 84.6 /100 | #142 | Excellent 19.7% |
| Slavs | 84.4 /100 | #143 | Excellent 19.7% |
| Immigrants | Northern Africa | 84.1 /100 | #144 | Excellent 19.7% |
| Canadians | 83.8 /100 | #145 | Excellent 19.7% |
| Immigrants | Bosnia and Herzegovina | 83.6 /100 | #146 | Excellent 19.7% |
| Immigrants | Austria | 83.1 /100 | #147 | Excellent 19.7% |
| Immigrants | Latin America | 81.3 /100 | #148 | Excellent 19.7% |
| Immigrants | Oceania | 81.2 /100 | #149 | Excellent 19.7% |
| Syrians | 80.2 /100 | #150 | Excellent 19.8% |
| Immigrants | Eastern Asia | 79.7 /100 | #151 | Good 19.8% |