South American vs Cuban Poverty
COMPARE
South American
Cuban
Poverty
Poverty Comparison
South Americans
Cubans
12.3%
POVERTY
48.7/ 100
METRIC RATING
175th/ 347
METRIC RANK
13.9%
POVERTY
0.6/ 100
METRIC RATING
235th/ 347
METRIC RANK
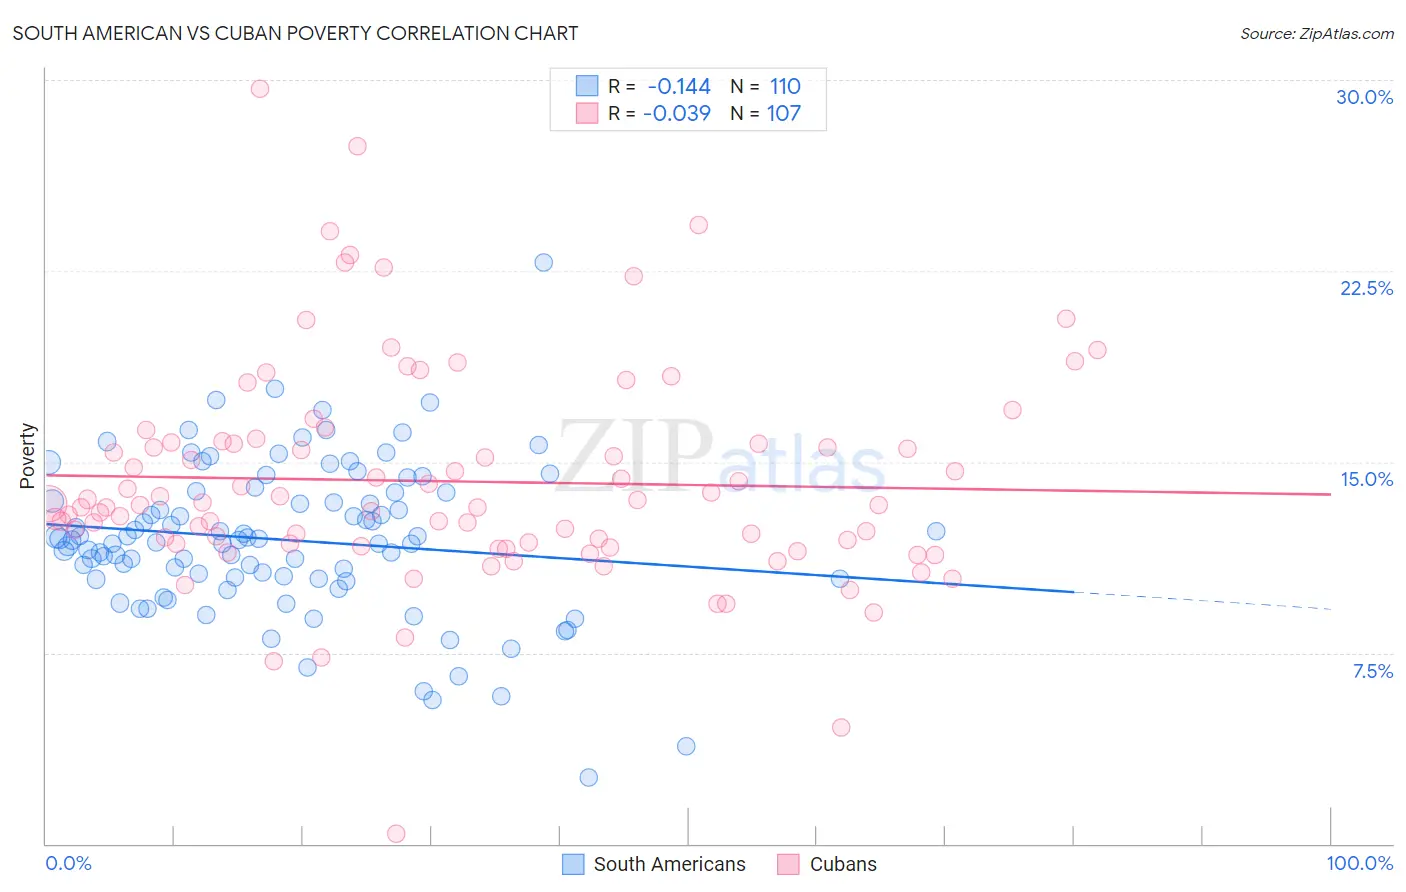
South American vs Cuban Poverty Correlation Chart
The statistical analysis conducted on geographies consisting of 493,572,716 people shows a poor negative correlation between the proportion of South Americans and poverty level in the United States with a correlation coefficient (R) of -0.144 and weighted average of 12.3%. Similarly, the statistical analysis conducted on geographies consisting of 448,978,860 people shows no correlation between the proportion of Cubans and poverty level in the United States with a correlation coefficient (R) of -0.039 and weighted average of 13.9%, a difference of 12.4%.
Poverty Correlation Summary
| Measurement | South American | Cuban |
| Minimum | 2.6% | 0.38% |
| Maximum | 22.8% | 29.6% |
| Range | 20.2% | 29.3% |
| Mean | 11.9% | 14.2% |
| Median | 11.9% | 13.3% |
| Interquartile 25% (IQ1) | 10.4% | 11.8% |
| Interquartile 75% (IQ3) | 13.8% | 15.7% |
| Interquartile Range (IQR) | 3.4% | 4.0% |
| Standard Deviation (Sample) | 3.0% | 4.3% |
| Standard Deviation (Population) | 3.0% | 4.3% |
Similar Demographics by Poverty
Demographics Similar to South Americans by Poverty
In terms of poverty, the demographic groups most similar to South Americans are Immigrants from Colombia (12.3%, a difference of 0.090%), Immigrants from Syria (12.3%, a difference of 0.12%), Lebanese (12.3%, a difference of 0.13%), Celtic (12.3%, a difference of 0.14%), and Immigrants from Portugal (12.3%, a difference of 0.18%).
| Demographics | Rating | Rank | Poverty |
| Immigrants | Venezuela | 56.5 /100 | #168 | Average 12.2% |
| Whites/Caucasians | 55.4 /100 | #169 | Average 12.3% |
| Immigrants | Oceania | 54.6 /100 | #170 | Average 12.3% |
| Immigrants | Spain | 51.3 /100 | #171 | Average 12.3% |
| Immigrants | Portugal | 50.5 /100 | #172 | Average 12.3% |
| Celtics | 50.1 /100 | #173 | Average 12.3% |
| Lebanese | 50.0 /100 | #174 | Average 12.3% |
| South Americans | 48.7 /100 | #175 | Average 12.3% |
| Immigrants | Colombia | 47.7 /100 | #176 | Average 12.3% |
| Immigrants | Syria | 47.5 /100 | #177 | Average 12.3% |
| Uruguayans | 44.7 /100 | #178 | Average 12.4% |
| Immigrants | Morocco | 44.0 /100 | #179 | Average 12.4% |
| Mongolians | 43.6 /100 | #180 | Average 12.4% |
| Immigrants | Afghanistan | 42.1 /100 | #181 | Average 12.4% |
| Immigrants | Cameroon | 41.7 /100 | #182 | Average 12.4% |
Demographics Similar to Cubans by Poverty
In terms of poverty, the demographic groups most similar to Cubans are Immigrants from Armenia (13.9%, a difference of 0.040%), French American Indian (13.9%, a difference of 0.060%), Ghanaian (13.9%, a difference of 0.19%), Immigrants from Laos (13.8%, a difference of 0.44%), and Nicaraguan (13.9%, a difference of 0.54%).
| Demographics | Rating | Rank | Poverty |
| Immigrants | Nigeria | 1.7 /100 | #228 | Tragic 13.5% |
| Osage | 1.5 /100 | #229 | Tragic 13.6% |
| Alaskan Athabascans | 1.5 /100 | #230 | Tragic 13.6% |
| Nigerians | 1.4 /100 | #231 | Tragic 13.6% |
| Fijians | 0.8 /100 | #232 | Tragic 13.7% |
| Immigrants | Saudi Arabia | 0.8 /100 | #233 | Tragic 13.8% |
| Immigrants | Laos | 0.7 /100 | #234 | Tragic 13.8% |
| Cubans | 0.6 /100 | #235 | Tragic 13.9% |
| Immigrants | Armenia | 0.5 /100 | #236 | Tragic 13.9% |
| French American Indians | 0.5 /100 | #237 | Tragic 13.9% |
| Ghanaians | 0.5 /100 | #238 | Tragic 13.9% |
| Nicaraguans | 0.4 /100 | #239 | Tragic 13.9% |
| Immigrants | Middle Africa | 0.4 /100 | #240 | Tragic 14.0% |
| Salvadorans | 0.4 /100 | #241 | Tragic 14.0% |
| Ecuadorians | 0.4 /100 | #242 | Tragic 14.0% |