South American vs Cuban Median Family Income
COMPARE
South American
Cuban
Median Family Income
Median Family Income Comparison
South Americans
Cubans
$101,856
MEDIAN FAMILY INCOME
39.7/ 100
METRIC RATING
179th/ 347
METRIC RANK
$84,981
MEDIAN FAMILY INCOME
0.0/ 100
METRIC RATING
312th/ 347
METRIC RANK
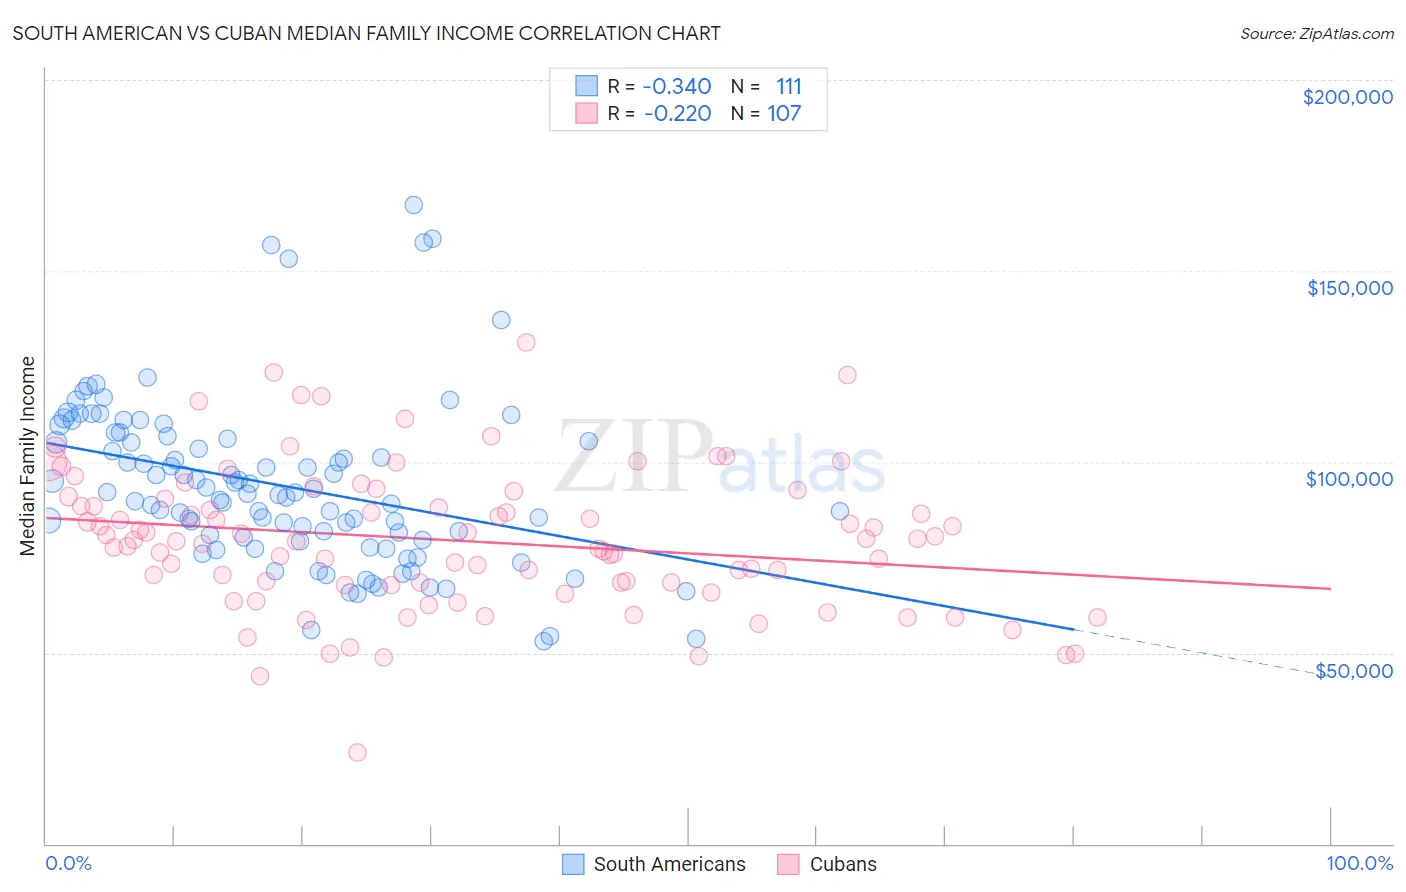
South American vs Cuban Median Family Income Correlation Chart
The statistical analysis conducted on geographies consisting of 493,360,337 people shows a mild negative correlation between the proportion of South Americans and median family income in the United States with a correlation coefficient (R) of -0.340 and weighted average of $101,856. Similarly, the statistical analysis conducted on geographies consisting of 448,691,327 people shows a weak negative correlation between the proportion of Cubans and median family income in the United States with a correlation coefficient (R) of -0.220 and weighted average of $84,981, a difference of 19.9%.
Median Family Income Correlation Summary
| Measurement | South American | Cuban |
| Minimum | $53,167 | $23,750 |
| Maximum | $167,114 | $131,198 |
| Range | $113,947 | $107,448 |
| Mean | $93,843 | $79,388 |
| Median | $91,692 | $79,353 |
| Interquartile 25% (IQ1) | $79,466 | $67,815 |
| Interquartile 75% (IQ3) | $105,899 | $90,371 |
| Interquartile Range (IQR) | $26,433 | $22,555 |
| Standard Deviation (Sample) | $21,858 | $18,688 |
| Standard Deviation (Population) | $21,760 | $18,601 |
Similar Demographics by Median Family Income
Demographics Similar to South Americans by Median Family Income
In terms of median family income, the demographic groups most similar to South Americans are French Canadian ($101,634, a difference of 0.22%), Spaniard ($101,617, a difference of 0.23%), Welsh ($102,151, a difference of 0.29%), Tsimshian ($101,543, a difference of 0.31%), and German ($102,254, a difference of 0.39%).
| Demographics | Rating | Rank | Median Family Income |
| Immigrants | Eritrea | 51.9 /100 | #172 | Average $102,823 |
| Belgians | 51.4 /100 | #173 | Average $102,788 |
| Finns | 50.0 /100 | #174 | Average $102,676 |
| Immigrants | Eastern Africa | 47.1 /100 | #175 | Average $102,451 |
| French | 46.1 /100 | #176 | Average $102,368 |
| Germans | 44.6 /100 | #177 | Average $102,254 |
| Welsh | 43.3 /100 | #178 | Average $102,151 |
| South Americans | 39.7 /100 | #179 | Fair $101,856 |
| French Canadians | 37.0 /100 | #180 | Fair $101,634 |
| Spaniards | 36.8 /100 | #181 | Fair $101,617 |
| Tsimshian | 35.9 /100 | #182 | Fair $101,543 |
| Kenyans | 34.5 /100 | #183 | Fair $101,417 |
| Immigrants | Costa Rica | 33.7 /100 | #184 | Fair $101,354 |
| Dutch | 31.9 /100 | #185 | Fair $101,192 |
| Celtics | 31.3 /100 | #186 | Fair $101,139 |
Demographics Similar to Cubans by Median Family Income
In terms of median family income, the demographic groups most similar to Cubans are Honduran ($85,004, a difference of 0.030%), Immigrants from Central America ($85,050, a difference of 0.080%), Choctaw ($84,835, a difference of 0.17%), Haitian ($85,218, a difference of 0.28%), and Immigrants from Bahamas ($84,732, a difference of 0.29%).
| Demographics | Rating | Rank | Median Family Income |
| Paiute | 0.0 /100 | #305 | Tragic $85,414 |
| Immigrants | Dominica | 0.0 /100 | #306 | Tragic $85,411 |
| Chickasaw | 0.0 /100 | #307 | Tragic $85,356 |
| U.S. Virgin Islanders | 0.0 /100 | #308 | Tragic $85,294 |
| Haitians | 0.0 /100 | #309 | Tragic $85,218 |
| Immigrants | Central America | 0.0 /100 | #310 | Tragic $85,050 |
| Hondurans | 0.0 /100 | #311 | Tragic $85,004 |
| Cubans | 0.0 /100 | #312 | Tragic $84,981 |
| Choctaw | 0.0 /100 | #313 | Tragic $84,835 |
| Immigrants | Bahamas | 0.0 /100 | #314 | Tragic $84,732 |
| Apache | 0.0 /100 | #315 | Tragic $84,451 |
| Immigrants | Haiti | 0.0 /100 | #316 | Tragic $84,018 |
| Yakama | 0.0 /100 | #317 | Tragic $83,932 |
| Immigrants | Mexico | 0.0 /100 | #318 | Tragic $83,639 |
| Immigrants | Honduras | 0.0 /100 | #319 | Tragic $83,618 |