South American vs British Married-Couple Family Poverty

COMPARE

South American
Race
Ancestry
AfghanAfricanAlaska NativeAlaskan AthabascanAlbanianAleutAlsatianAmericanApacheArabArapahoArgentineanArmenianAssyrian/Chaldean/SyriacAustralianAustrianBahamianBangladeshiBarbadianBasqueBelgianBelizeanBermudanBhutaneseBlackfeetBolivianBrazilianBritish West IndianBulgarianBurmeseCajunCambodianCanadianCape VerdeanCarpatho RusynCelticCentral AmericanCentral American IndianCherokeeCheyenneChickasawChileanChineseChippewaChoctawColombianColvilleComancheCosta RicanCreeCreekCroatianCrowCubanCypriotCzechCzechoslovakianDanishDelawareDominicanDutchDutch West IndianEastern EuropeanEcuadorianEgyptianEnglishEstonianEthiopianEuropeanFijianFilipinoFinnishFrenchFrench American IndianFrench CanadianGermanGerman RussianGhanaianGreekGuamanian/ChamorroGuatemalanGuyaneseHaitianHmongHonduranHopiHoumaHungarianIcelanderIndian (Asian)IndonesianInupiatIranianIraqiIrishIroquoisIsraeliItalianJamaicanJapaneseJordanianKenyanKiowaKoreanLaotianLatvianLebaneseLiberianLithuanianLumbeeLuxembourgerMacedonianMalaysianMalteseMarshalleseMenomineeMexicanMexican American IndianMongolianMoroccanNative HawaiianNavajoNepaleseNew ZealanderNicaraguanNigerianNorthern EuropeanNorwegianOkinawanOsageOttawaPaiutePakistaniPalestinianPanamanianParaguayanPennsylvania GermanPeruvianPimaPolishPortuguesePotawatomiPuebloPuerto RicanPuget Sound SalishRomanianRussianSalvadoranSamoanScandinavianScotch-IrishScottishSeminoleSenegaleseSerbianShoshoneSierra LeoneanSiouxSlavicSlovakSloveneSomaliSouth AfricanSouth AmericanSouth American IndianSoviet UnionSpaniardSpanishSpanish AmericanSpanish American IndianSri LankanSubsaharan AfricanSudaneseSwedishSwissSyrianTaiwaneseThaiTlingit-HaidaTohono O'OdhamTonganTrinidadian and TobagonianTsimshianTurkishU.S. Virgin IslanderUgandanUkrainianUruguayanUteVenezuelanVietnameseWelshWest IndianYakamaYaquiYugoslavianYumanYup'ikZimbabwean
Immigration
NonimmigrantsImmigrantsAfghanistanAfricaAlbaniaArgentinaArmeniaAsiaAustraliaAustriaBahamasBangladeshBarbadosBelarusBelgiumBelizeBoliviaBosnia and HerzegovinaBrazilBulgariaBurma/MyanmarCabo VerdeCambodiaCameroonCanadaCaribbeanCentral AmericaChileChinaColombiaCongoCosta RicaCroatiaCubaCzechoslovakiaDenmarkDominicaDominican RepublicEastern AfricaEastern AsiaEastern EuropeEcuadorEgyptEl SalvadorEnglandEritreaEthiopiaEuropeFijiFranceGermanyGhanaGreeceGrenadaGuatemalaGuyanaHaitiHondurasHong KongHungaryIndiaIndonesiaIranIraqIrelandIsraelItalyJamaicaJapanJordanKazakhstanKenyaKoreaKuwaitLaosLatin AmericaLatviaLebanonLiberiaLithuaniaMalaysiaMexicoMicronesiaMiddle AfricaMoldovaMoroccoNepalNetherlandsNicaraguaNigeriaNorth AmericaNorth MacedoniaNorthern AfricaNorthern EuropeNorwayOceaniaPakistanPanamaPeruPhilippinesPolandPortugalRomaniaRussiaSaudi ArabiaScotlandSenegalSerbiaSierra LeoneSingaporeSomaliaSouth AfricaSouth AmericaSouth Central AsiaSouth Eastern AsiaSouthern EuropeSpainSri LankaSt. Vincent and the GrenadinesSudanSwedenSwitzerlandSyriaTaiwanThailandTrinidad and TobagoTurkeyUgandaUkraineUruguayUzbekistanVenezuelaVietnamWest IndiesWestern AfricaWestern AsiaWestern EuropeYemenZaireZimbabweAzores
British
Race
Ancestry
AfghanAfricanAlaska NativeAlaskan AthabascanAlbanianAleutAlsatianAmericanApacheArabArapahoArgentineanArmenianAssyrian/Chaldean/SyriacAustralianAustrianBahamianBangladeshiBarbadianBasqueBelgianBelizeanBermudanBhutaneseBlackfeetBolivianBrazilianBritishBritish West IndianBulgarianBurmeseCajunCambodianCanadianCape VerdeanCarpatho RusynCelticCentral AmericanCentral American IndianCherokeeCheyenneChickasawChileanChineseChippewaChoctawColombianColvilleComancheCosta RicanCreeCreekCroatianCrowCubanCypriotCzechCzechoslovakianDanishDelawareDominicanDutchDutch West IndianEastern EuropeanEcuadorianEgyptianEnglishEstonianEthiopianEuropeanFijianFilipinoFinnishFrenchFrench American IndianFrench CanadianGermanGerman RussianGhanaianGreekGuamanian/ChamorroGuatemalanGuyaneseHaitianHmongHonduranHopiHoumaHungarianIcelanderIndian (Asian)IndonesianInupiatIranianIraqiIrishIroquoisIsraeliItalianJamaicanJapaneseJordanianKenyanKiowaKoreanLaotianLatvianLebaneseLiberianLithuanianLumbeeLuxembourgerMacedonianMalaysianMalteseMarshalleseMenomineeMexicanMexican American IndianMongolianMoroccanNative HawaiianNavajoNepaleseNew ZealanderNicaraguanNigerianNorthern EuropeanNorwegianOkinawanOsageOttawaPaiutePakistaniPalestinianPanamanianParaguayanPennsylvania GermanPeruvianPimaPolishPortuguesePotawatomiPuebloPuerto RicanPuget Sound SalishRomanianRussianSalvadoranSamoanScandinavianScotch-IrishScottishSeminoleSenegaleseSerbianShoshoneSierra LeoneanSiouxSlavicSlovakSloveneSomaliSouth AfricanSouth American IndianSoviet UnionSpaniardSpanishSpanish AmericanSpanish American IndianSri LankanSubsaharan AfricanSudaneseSwedishSwissSyrianTaiwaneseThaiTlingit-HaidaTohono O'OdhamTonganTrinidadian and TobagonianTsimshianTurkishU.S. Virgin IslanderUgandanUkrainianUruguayanUteVenezuelanVietnameseWelshWest IndianYakamaYaquiYugoslavianYumanYup'ikZimbabwean
Immigration
NonimmigrantsImmigrantsAfghanistanAfricaAlbaniaArgentinaArmeniaAsiaAustraliaAustriaBahamasBangladeshBarbadosBelarusBelgiumBelizeBoliviaBosnia and HerzegovinaBrazilBulgariaBurma/MyanmarCabo VerdeCambodiaCameroonCanadaCaribbeanCentral AmericaChileChinaColombiaCongoCosta RicaCroatiaCubaCzechoslovakiaDenmarkDominicaDominican RepublicEastern AfricaEastern AsiaEastern EuropeEcuadorEgyptEl SalvadorEnglandEritreaEthiopiaEuropeFijiFranceGermanyGhanaGreeceGrenadaGuatemalaGuyanaHaitiHondurasHong KongHungaryIndiaIndonesiaIranIraqIrelandIsraelItalyJamaicaJapanJordanKazakhstanKenyaKoreaKuwaitLaosLatin AmericaLatviaLebanonLiberiaLithuaniaMalaysiaMexicoMicronesiaMiddle AfricaMoldovaMoroccoNepalNetherlandsNicaraguaNigeriaNorth AmericaNorth MacedoniaNorthern AfricaNorthern EuropeNorwayOceaniaPakistanPanamaPeruPhilippinesPolandPortugalRomaniaRussiaSaudi ArabiaScotlandSenegalSerbiaSierra LeoneSingaporeSomaliaSouth AfricaSouth AmericaSouth Central AsiaSouth Eastern AsiaSouthern EuropeSpainSri LankaSt. Vincent and the GrenadinesSudanSwedenSwitzerlandSyriaTaiwanThailandTrinidad and TobagoTurkeyUgandaUkraineUruguayUzbekistanVenezuelaVietnamWest IndiesWestern AfricaWestern AsiaWestern EuropeYemenZaireZimbabweAzores
Married-Couple Family Poverty
Income
Poverty
Unemployment
Labor Participation
Family Structure
Vehicle Availability
Education Level
Disability

Married-Couple Family Poverty Comparison

South Americans

British

Tragic
Exceptional
5.6%
MARRIED-COUPLE FAMILY POVERTY
5.7/ 100
METRIC RATING
226th/ 347
METRIC RANK
4.3%
MARRIED-COUPLE FAMILY POVERTY
99.8/ 100
METRIC RATING
46th/ 347
METRIC RANK

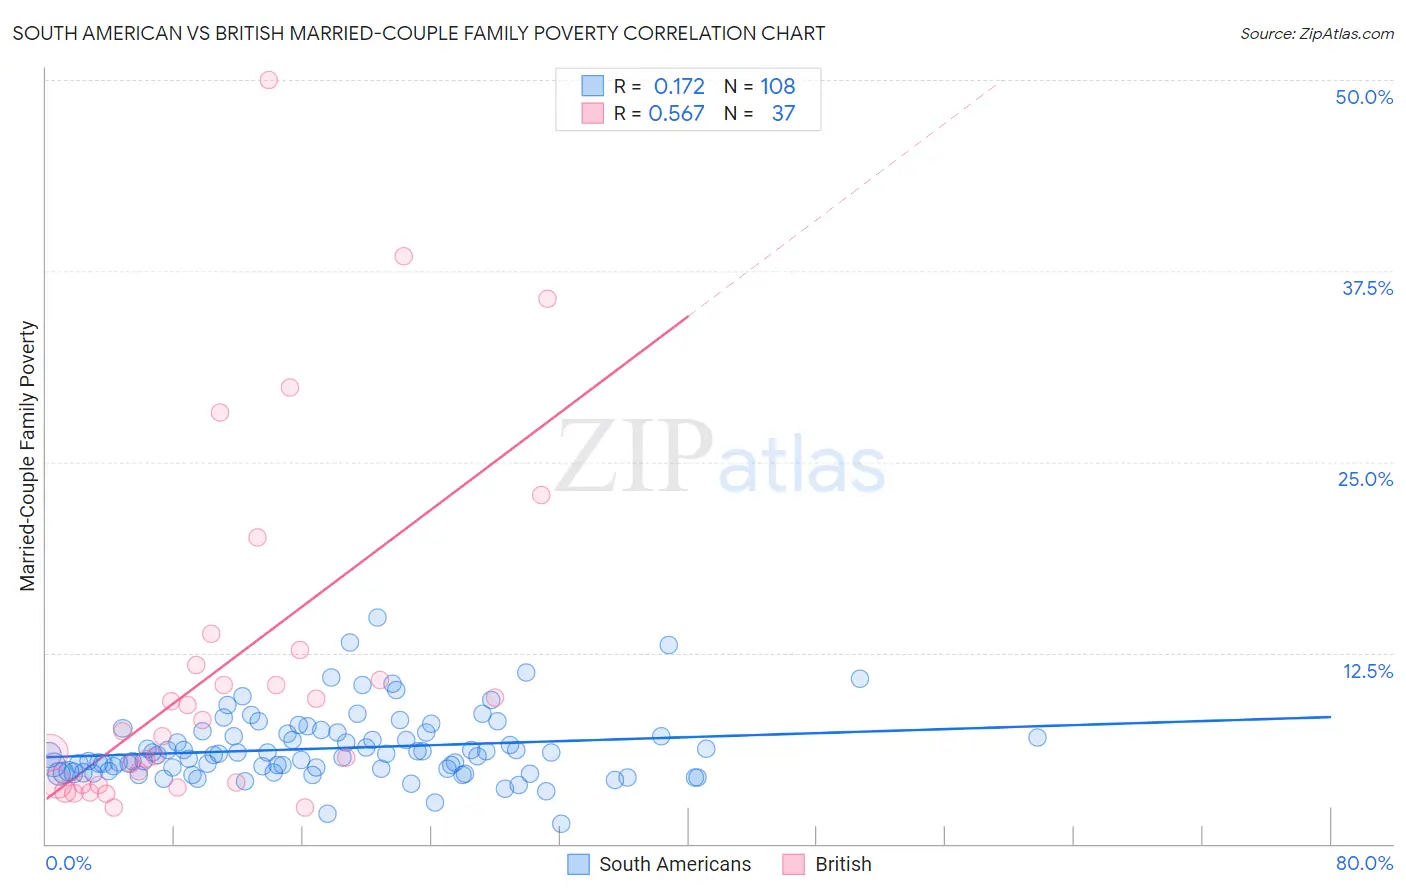
South American vs British Married-Couple Family Poverty Correlation Chart

The statistical analysis conducted on geographies consisting of 487,269,778 people shows a poor positive correlation between the proportion of South Americans and poverty level among married-couple families in the United States with a correlation coefficient (R) of 0.172 and weighted average of 5.6%. Similarly, the statistical analysis conducted on geographies consisting of 521,525,466 people shows a substantial positive correlation between the proportion of British and poverty level among married-couple families in the United States with a correlation coefficient (R) of 0.567 and weighted average of 4.3%, a difference of 31.2%.
South American vs British Married-Couple Family Poverty

Married-Couple Family Poverty Correlation Summary

MeasurementSouth AmericanBritish
Minimum1.3%2.4%
Maximum14.8%50.0%
Range13.6%47.6%
Mean6.2%11.5%
Median5.8%7.3%
Interquartile 25% (IQ1)4.8%3.9%
Interquartile 75% (IQ3)7.2%12.2%
Interquartile Range (IQR)2.5%8.3%
Standard Deviation (Sample)2.2%11.3%
Standard Deviation (Population)2.2%11.2%

Similar Demographics by Married-Couple Family Poverty

Demographics Similar to South Americans by Married-Couple Family Poverty

In terms of married-couple family poverty, the demographic groups most similar to South Americans are Immigrants from Zaire (5.6%, a difference of 0.020%), Arab (5.7%, a difference of 0.15%), Immigrants from Cambodia (5.6%, a difference of 0.22%), Sudanese (5.6%, a difference of 0.37%), and Subsaharan African (5.7%, a difference of 0.40%).
DemographicsRating | RankMarried-Couple Family Poverty
Japanese
9.8
/100
|
#219
Tragic
5.6%
Colombians
9.2
/100
|
#220
Tragic
5.6%
Panamanians
9.2
/100
|
#221
Tragic
5.6%
Cajuns
6.9
/100
|
#222
Tragic
5.6%
Immigrants | Fiji
6.7
/100
|
#223
Tragic
5.6%
Sudanese
6.4
/100
|
#224
Tragic
5.6%
Immigrants | Cambodia
6.1
/100
|
#225
Tragic
5.6%
South Americans
5.7
/100
|
#226
Tragic
5.6%
Immigrants | Zaire
5.6
/100
|
#227
Tragic
5.6%
Arabs
5.4
/100
|
#228
Tragic
5.7%
Sub-Saharan Africans
4.9
/100
|
#229
Tragic
5.7%
Moroccans
4.9
/100
|
#230
Tragic
5.7%
Immigrants | Iraq
4.4
/100
|
#231
Tragic
5.7%
Immigrants | Laos
4.4
/100
|
#232
Tragic
5.7%
Immigrants | Colombia
3.7
/100
|
#233
Tragic
5.7%

Demographics Similar to British by Married-Couple Family Poverty

In terms of married-couple family poverty, the demographic groups most similar to British are Serbian (4.3%, a difference of 0.030%), Immigrants from Japan (4.3%, a difference of 0.050%), Immigrants from South Central Asia (4.3%, a difference of 0.12%), Australian (4.3%, a difference of 0.19%), and Turkish (4.3%, a difference of 0.27%).
DemographicsRating | RankMarried-Couple Family Poverty
Immigrants | Northern Europe
99.8
/100
|
#39
Exceptional
4.2%
French Canadians
99.8
/100
|
#40
Exceptional
4.2%
Northern Europeans
99.8
/100
|
#41
Exceptional
4.3%
Scottish
99.8
/100
|
#42
Exceptional
4.3%
Swiss
99.8
/100
|
#43
Exceptional
4.3%
Immigrants | Japan
99.8
/100
|
#44
Exceptional
4.3%
Serbians
99.8
/100
|
#45
Exceptional
4.3%
British
99.8
/100
|
#46
Exceptional
4.3%
Immigrants | South Central Asia
99.8
/100
|
#47
Exceptional
4.3%
Australians
99.7
/100
|
#48
Exceptional
4.3%
Turks
99.7
/100
|
#49
Exceptional
4.3%
Burmese
99.7
/100
|
#50
Exceptional
4.3%
Immigrants | Lithuania
99.7
/100
|
#51
Exceptional
4.3%
Russians
99.7
/100
|
#52
Exceptional
4.3%
Welsh
99.7
/100
|
#53
Exceptional
4.3%