South American Indian vs Comanche Child Poverty Among Girls Under 16
COMPARE
South American Indian
Comanche
Child Poverty Among Girls Under 16
Child Poverty Among Girls Under 16 Comparison
South American Indians
Comanche
16.8%
CHILD POVERTY AMONG GIRLS UNDER 16
35.0/ 100
METRIC RATING
186th/ 347
METRIC RANK
20.2%
CHILD POVERTY AMONG GIRLS UNDER 16
0.0/ 100
METRIC RATING
276th/ 347
METRIC RANK
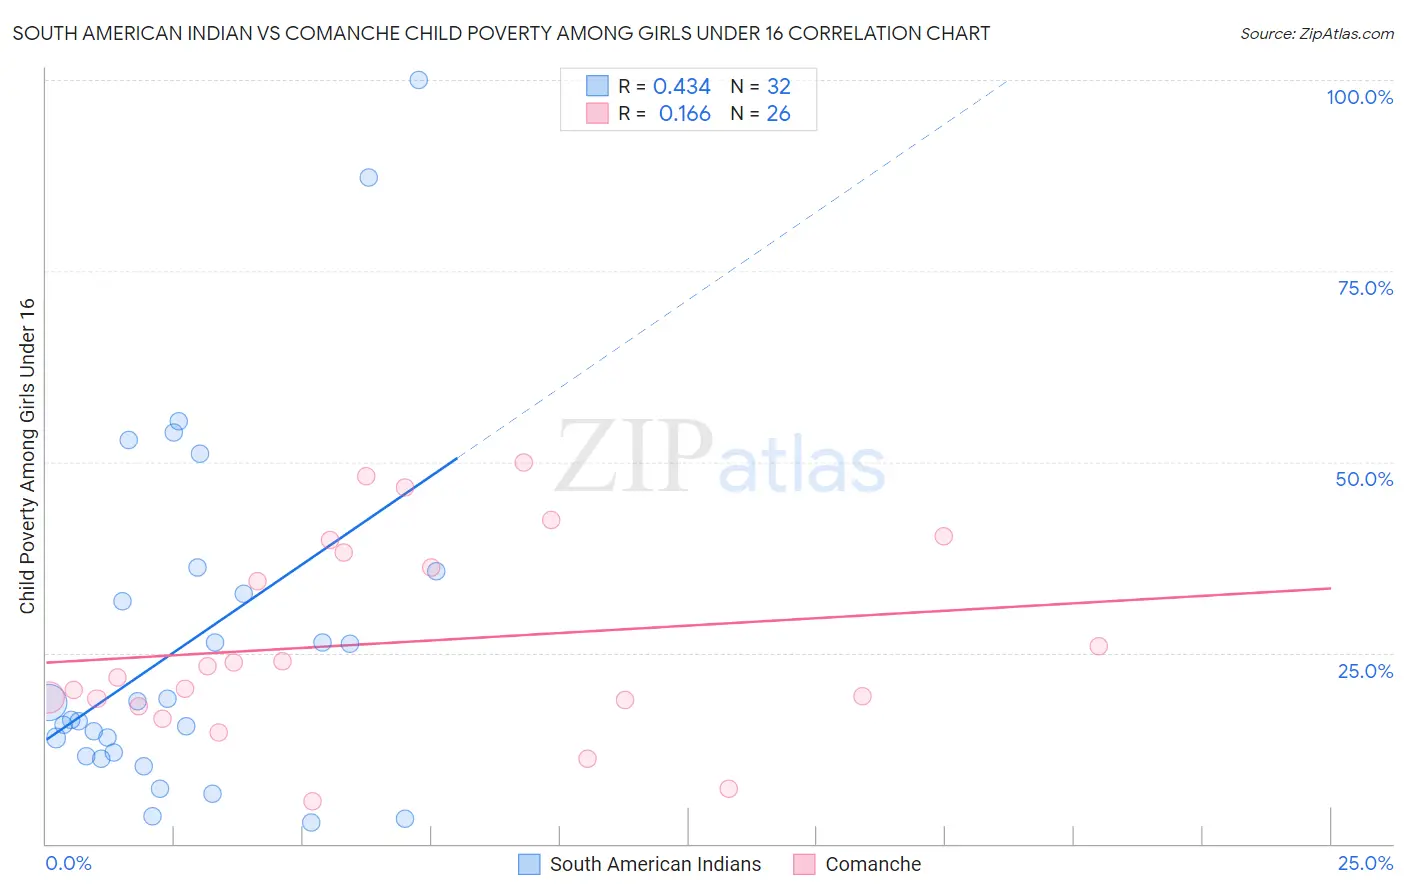
South American Indian vs Comanche Child Poverty Among Girls Under 16 Correlation Chart
The statistical analysis conducted on geographies consisting of 163,506,880 people shows a moderate positive correlation between the proportion of South American Indians and poverty level among girls under the age of 16 in the United States with a correlation coefficient (R) of 0.434 and weighted average of 16.8%. Similarly, the statistical analysis conducted on geographies consisting of 109,392,517 people shows a poor positive correlation between the proportion of Comanche and poverty level among girls under the age of 16 in the United States with a correlation coefficient (R) of 0.166 and weighted average of 20.2%, a difference of 20.4%.
Child Poverty Among Girls Under 16 Correlation Summary
| Measurement | South American Indian | Comanche |
| Minimum | 2.7% | 5.6% |
| Maximum | 100.0% | 50.0% |
| Range | 97.3% | 44.4% |
| Mean | 26.4% | 26.3% |
| Median | 17.4% | 22.5% |
| Interquartile 25% (IQ1) | 11.7% | 18.9% |
| Interquartile 75% (IQ3) | 34.3% | 38.2% |
| Interquartile Range (IQR) | 22.5% | 19.3% |
| Standard Deviation (Sample) | 23.2% | 12.7% |
| Standard Deviation (Population) | 22.8% | 12.5% |
Similar Demographics by Child Poverty Among Girls Under 16
Demographics Similar to South American Indians by Child Poverty Among Girls Under 16
In terms of child poverty among girls under 16, the demographic groups most similar to South American Indians are Immigrants from Morocco (16.8%, a difference of 0.050%), Arab (16.8%, a difference of 0.060%), Immigrants from Uruguay (16.7%, a difference of 0.070%), Immigrants from Bosnia and Herzegovina (16.8%, a difference of 0.31%), and Kenyan (16.8%, a difference of 0.35%).
| Demographics | Rating | Rank | Child Poverty Among Girls Under 16 |
| Hawaiians | 43.4 /100 | #179 | Average 16.6% |
| Immigrants | Syria | 43.3 /100 | #180 | Average 16.6% |
| Immigrants | Iraq | 43.2 /100 | #181 | Average 16.6% |
| Immigrants | Ethiopia | 43.1 /100 | #182 | Average 16.6% |
| Immigrants | Portugal | 42.5 /100 | #183 | Average 16.6% |
| Scotch-Irish | 39.6 /100 | #184 | Fair 16.7% |
| Immigrants | Uruguay | 35.6 /100 | #185 | Fair 16.7% |
| South American Indians | 35.0 /100 | #186 | Fair 16.8% |
| Immigrants | Morocco | 34.6 /100 | #187 | Fair 16.8% |
| Arabs | 34.5 /100 | #188 | Fair 16.8% |
| Immigrants | Bosnia and Herzegovina | 32.5 /100 | #189 | Fair 16.8% |
| Kenyans | 32.3 /100 | #190 | Fair 16.8% |
| Immigrants | Azores | 31.3 /100 | #191 | Fair 16.8% |
| Immigrants | Uganda | 31.3 /100 | #192 | Fair 16.8% |
| Aleuts | 28.7 /100 | #193 | Fair 16.9% |
Demographics Similar to Comanche by Child Poverty Among Girls Under 16
In terms of child poverty among girls under 16, the demographic groups most similar to Comanche are Belizean (20.2%, a difference of 0.11%), Barbadian (20.2%, a difference of 0.14%), Immigrants from Zaire (20.2%, a difference of 0.27%), Immigrants from Liberia (20.2%, a difference of 0.28%), and Subsaharan African (20.1%, a difference of 0.32%).
| Demographics | Rating | Rank | Child Poverty Among Girls Under 16 |
| Liberians | 0.1 /100 | #269 | Tragic 19.9% |
| Cherokee | 0.1 /100 | #270 | Tragic 19.9% |
| Immigrants | Barbados | 0.1 /100 | #271 | Tragic 19.9% |
| Immigrants | El Salvador | 0.1 /100 | #272 | Tragic 20.0% |
| Bangladeshis | 0.1 /100 | #273 | Tragic 20.0% |
| Immigrants | St. Vincent and the Grenadines | 0.0 /100 | #274 | Tragic 20.1% |
| Sub-Saharan Africans | 0.0 /100 | #275 | Tragic 20.1% |
| Comanche | 0.0 /100 | #276 | Tragic 20.2% |
| Belizeans | 0.0 /100 | #277 | Tragic 20.2% |
| Barbadians | 0.0 /100 | #278 | Tragic 20.2% |
| Immigrants | Zaire | 0.0 /100 | #279 | Tragic 20.2% |
| Immigrants | Liberia | 0.0 /100 | #280 | Tragic 20.2% |
| Central Americans | 0.0 /100 | #281 | Tragic 20.2% |
| West Indians | 0.0 /100 | #282 | Tragic 20.3% |
| Senegalese | 0.0 /100 | #283 | Tragic 20.3% |