Slovene vs Immigrants from Hong Kong Family Poverty
COMPARE
Slovene
Immigrants from Hong Kong
Family Poverty
Family Poverty Comparison
Slovenes
Immigrants from Hong Kong
7.5%
FAMILY POVERTY
99.3/ 100
METRIC RATING
40th/ 347
METRIC RANK
7.3%
FAMILY POVERTY
99.7/ 100
METRIC RATING
20th/ 347
METRIC RANK
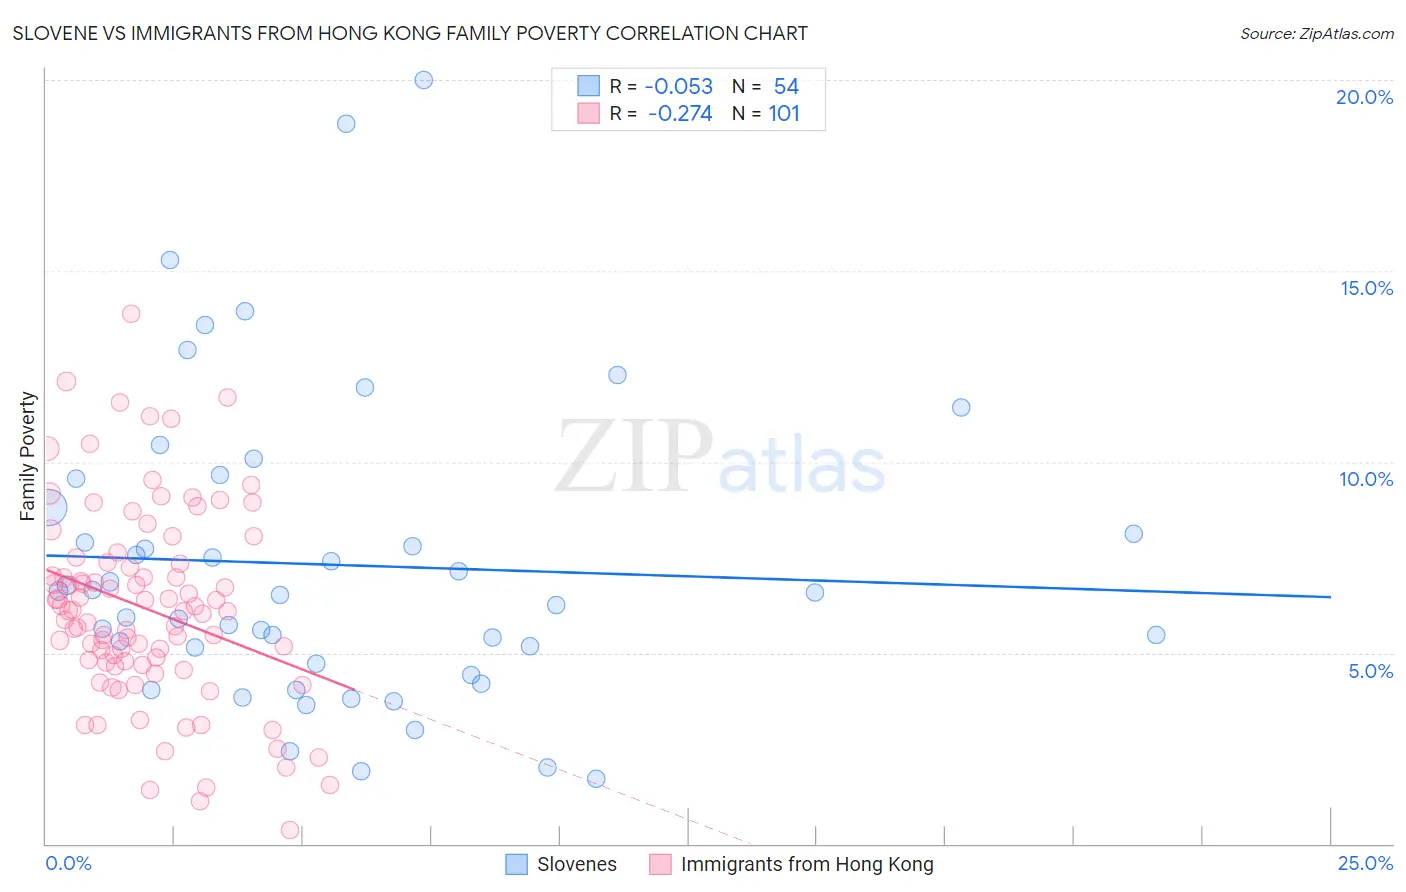
Slovene vs Immigrants from Hong Kong Family Poverty Correlation Chart
The statistical analysis conducted on geographies consisting of 260,812,664 people shows a slight negative correlation between the proportion of Slovenes and poverty level among families in the United States with a correlation coefficient (R) of -0.053 and weighted average of 7.5%. Similarly, the statistical analysis conducted on geographies consisting of 253,546,628 people shows a weak negative correlation between the proportion of Immigrants from Hong Kong and poverty level among families in the United States with a correlation coefficient (R) of -0.274 and weighted average of 7.3%, a difference of 4.0%.
Family Poverty Correlation Summary
| Measurement | Slovene | Immigrants from Hong Kong |
| Minimum | 1.7% | 0.35% |
| Maximum | 20.0% | 13.9% |
| Range | 18.3% | 13.5% |
| Mean | 7.3% | 6.2% |
| Median | 6.6% | 6.1% |
| Interquartile 25% (IQ1) | 4.7% | 4.7% |
| Interquartile 75% (IQ3) | 8.8% | 7.4% |
| Interquartile Range (IQR) | 4.1% | 2.6% |
| Standard Deviation (Sample) | 4.0% | 2.6% |
| Standard Deviation (Population) | 3.9% | 2.5% |
Demographics Similar to Slovenes and Immigrants from Hong Kong by Family Poverty
In terms of family poverty, the demographic groups most similar to Slovenes are Carpatho Rusyn (7.5%, a difference of 0.040%), Bolivian (7.5%, a difference of 0.10%), Estonian (7.5%, a difference of 0.34%), Turkish (7.5%, a difference of 0.51%), and Greek (7.5%, a difference of 0.52%). Similarly, the demographic groups most similar to Immigrants from Hong Kong are Immigrants from Iran (7.3%, a difference of 0.20%), Danish (7.3%, a difference of 0.64%), Assyrian/Chaldean/Syriac (7.3%, a difference of 0.65%), Croatian (7.3%, a difference of 0.96%), and Burmese (7.3%, a difference of 0.96%).
| Demographics | Rating | Rank | Family Poverty |
| Immigrants | Hong Kong | 99.7 /100 | #20 | Exceptional 7.3% |
| Immigrants | Iran | 99.7 /100 | #21 | Exceptional 7.3% |
| Danes | 99.7 /100 | #22 | Exceptional 7.3% |
| Assyrians/Chaldeans/Syriacs | 99.7 /100 | #23 | Exceptional 7.3% |
| Croatians | 99.7 /100 | #24 | Exceptional 7.3% |
| Burmese | 99.7 /100 | #25 | Exceptional 7.3% |
| Cypriots | 99.6 /100 | #26 | Exceptional 7.3% |
| Immigrants | Scotland | 99.6 /100 | #27 | Exceptional 7.3% |
| Immigrants | Korea | 99.6 /100 | #28 | Exceptional 7.4% |
| Immigrants | Northern Europe | 99.6 /100 | #29 | Exceptional 7.4% |
| Italians | 99.6 /100 | #30 | Exceptional 7.4% |
| Czechs | 99.6 /100 | #31 | Exceptional 7.4% |
| Poles | 99.5 /100 | #32 | Exceptional 7.4% |
| Immigrants | Japan | 99.5 /100 | #33 | Exceptional 7.4% |
| Russians | 99.5 /100 | #34 | Exceptional 7.5% |
| Greeks | 99.4 /100 | #35 | Exceptional 7.5% |
| Turks | 99.4 /100 | #36 | Exceptional 7.5% |
| Estonians | 99.4 /100 | #37 | Exceptional 7.5% |
| Bolivians | 99.3 /100 | #38 | Exceptional 7.5% |
| Carpatho Rusyns | 99.3 /100 | #39 | Exceptional 7.5% |
| Slovenes | 99.3 /100 | #40 | Exceptional 7.5% |