Slovene vs Costa Rican Female Poverty Among 18-24 Year Olds
COMPARE
Slovene
Costa Rican
Female Poverty Among 18-24 Year Olds
Female Poverty Among 18-24 Year Olds Comparison
Slovenes
Costa Ricans
19.3%
FEMALE POVERTY AMONG 18-24 YEAR OLDS
96.2/ 100
METRIC RATING
114th/ 347
METRIC RANK
18.8%
FEMALE POVERTY AMONG 18-24 YEAR OLDS
99.5/ 100
METRIC RATING
77th/ 347
METRIC RANK
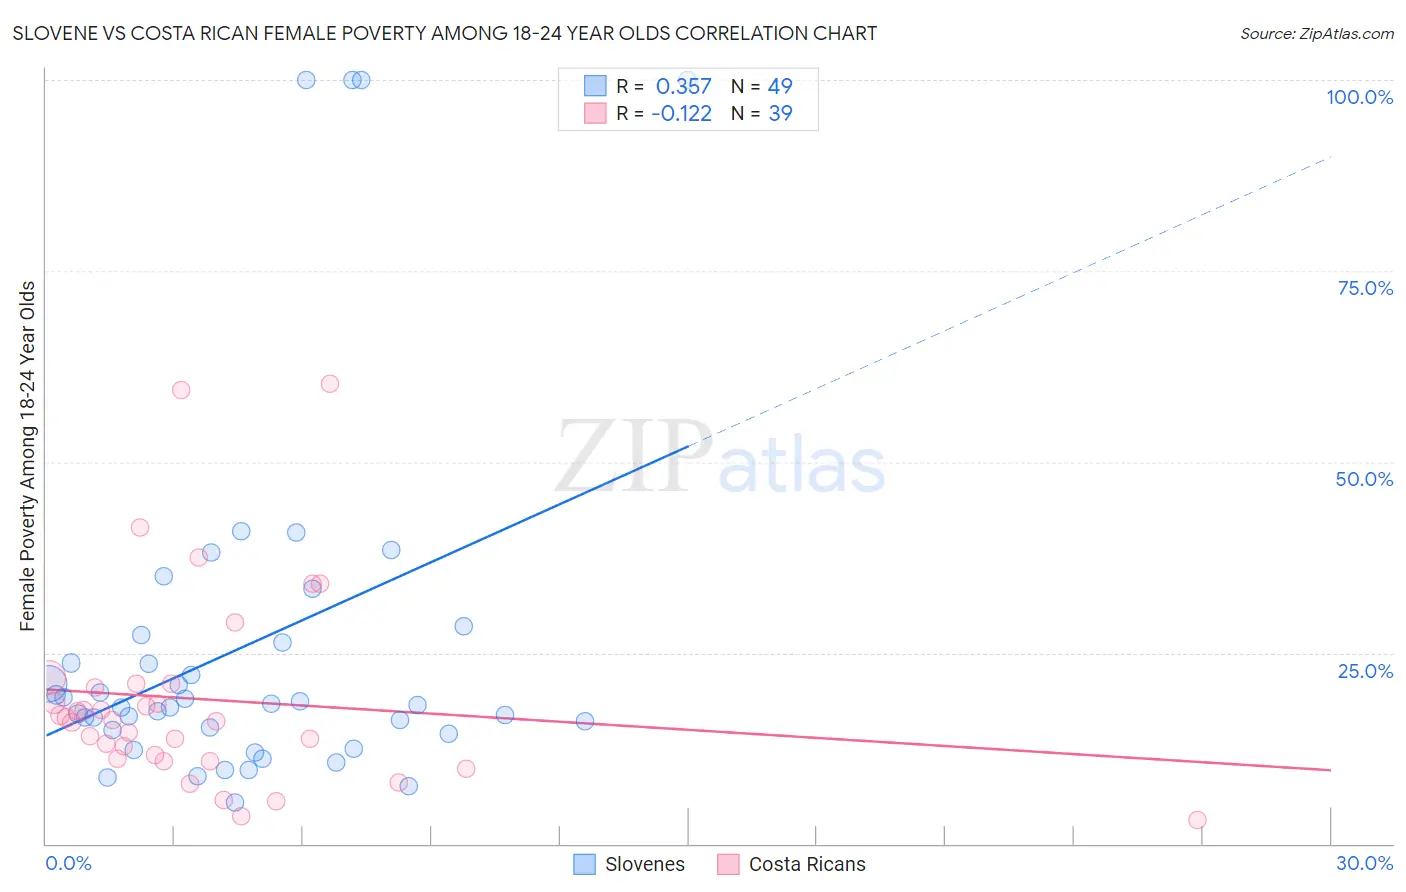
Slovene vs Costa Rican Female Poverty Among 18-24 Year Olds Correlation Chart
The statistical analysis conducted on geographies consisting of 255,615,835 people shows a mild positive correlation between the proportion of Slovenes and poverty level among females between the ages 18 and 24 in the United States with a correlation coefficient (R) of 0.357 and weighted average of 19.3%. Similarly, the statistical analysis conducted on geographies consisting of 250,266,306 people shows a poor negative correlation between the proportion of Costa Ricans and poverty level among females between the ages 18 and 24 in the United States with a correlation coefficient (R) of -0.122 and weighted average of 18.8%, a difference of 2.7%.
Female Poverty Among 18-24 Year Olds Correlation Summary
| Measurement | Slovene | Costa Rican |
| Minimum | 5.4% | 3.1% |
| Maximum | 100.0% | 60.2% |
| Range | 94.6% | 57.0% |
| Mean | 26.0% | 18.9% |
| Median | 18.2% | 16.2% |
| Interquartile 25% (IQ1) | 14.6% | 11.2% |
| Interquartile 75% (IQ3) | 26.8% | 20.9% |
| Interquartile Range (IQR) | 12.2% | 9.7% |
| Standard Deviation (Sample) | 23.9% | 13.0% |
| Standard Deviation (Population) | 23.6% | 12.8% |
Similar Demographics by Female Poverty Among 18-24 Year Olds
Demographics Similar to Slovenes by Female Poverty Among 18-24 Year Olds
In terms of female poverty among 18-24 year olds, the demographic groups most similar to Slovenes are Immigrants from Hungary (19.3%, a difference of 0.010%), Immigrants from Cameroon (19.3%, a difference of 0.040%), Immigrants from El Salvador (19.3%, a difference of 0.10%), Immigrants (19.3%, a difference of 0.11%), and Immigrants from Iran (19.3%, a difference of 0.15%).
| Demographics | Rating | Rank | Female Poverty Among 18-24 Year Olds |
| Immigrants | Sri Lanka | 97.5 /100 | #107 | Exceptional 19.2% |
| Immigrants | Uzbekistan | 97.3 /100 | #108 | Exceptional 19.2% |
| Immigrants | Syria | 97.2 /100 | #109 | Exceptional 19.2% |
| Laotians | 97.1 /100 | #110 | Exceptional 19.2% |
| Immigrants | Serbia | 97.1 /100 | #111 | Exceptional 19.2% |
| Immigrants | El Salvador | 96.5 /100 | #112 | Exceptional 19.3% |
| Immigrants | Cameroon | 96.3 /100 | #113 | Exceptional 19.3% |
| Slovenes | 96.2 /100 | #114 | Exceptional 19.3% |
| Immigrants | Hungary | 96.2 /100 | #115 | Exceptional 19.3% |
| Immigrants | Immigrants | 95.9 /100 | #116 | Exceptional 19.3% |
| Immigrants | Iran | 95.8 /100 | #117 | Exceptional 19.3% |
| Immigrants | Guyana | 95.6 /100 | #118 | Exceptional 19.3% |
| Cypriots | 95.5 /100 | #119 | Exceptional 19.3% |
| Immigrants | Northern Europe | 95.4 /100 | #120 | Exceptional 19.4% |
| Guyanese | 95.3 /100 | #121 | Exceptional 19.4% |
Demographics Similar to Costa Ricans by Female Poverty Among 18-24 Year Olds
In terms of female poverty among 18-24 year olds, the demographic groups most similar to Costa Ricans are Immigrants from Europe (18.8%, a difference of 0.010%), Uruguayan (18.8%, a difference of 0.010%), Palestinian (18.8%, a difference of 0.090%), Japanese (18.8%, a difference of 0.090%), and Immigrants from Cambodia (18.8%, a difference of 0.10%).
| Demographics | Rating | Rank | Female Poverty Among 18-24 Year Olds |
| Immigrants | Costa Rica | 99.7 /100 | #70 | Exceptional 18.7% |
| Immigrants | Haiti | 99.7 /100 | #71 | Exceptional 18.7% |
| Armenians | 99.7 /100 | #72 | Exceptional 18.7% |
| Lithuanians | 99.7 /100 | #73 | Exceptional 18.7% |
| Hawaiians | 99.6 /100 | #74 | Exceptional 18.7% |
| Poles | 99.6 /100 | #75 | Exceptional 18.8% |
| Immigrants | Cambodia | 99.5 /100 | #76 | Exceptional 18.8% |
| Costa Ricans | 99.5 /100 | #77 | Exceptional 18.8% |
| Immigrants | Europe | 99.5 /100 | #78 | Exceptional 18.8% |
| Uruguayans | 99.5 /100 | #79 | Exceptional 18.8% |
| Palestinians | 99.5 /100 | #80 | Exceptional 18.8% |
| Japanese | 99.5 /100 | #81 | Exceptional 18.8% |
| Immigrants | Uruguay | 99.4 /100 | #82 | Exceptional 18.8% |
| Immigrants | Indonesia | 99.4 /100 | #83 | Exceptional 18.9% |
| Burmese | 99.2 /100 | #84 | Exceptional 18.9% |