Immigrants from Colombia vs Costa Rican Female Poverty Among 18-24 Year Olds
COMPARE
Immigrants from Colombia
Costa Rican
Female Poverty Among 18-24 Year Olds
Female Poverty Among 18-24 Year Olds Comparison
Immigrants from Colombia
Costa Ricans
17.3%
FEMALE POVERTY AMONG 18-24 YEAR OLDS
100.0/ 100
METRIC RATING
18th/ 347
METRIC RANK
18.8%
FEMALE POVERTY AMONG 18-24 YEAR OLDS
99.5/ 100
METRIC RATING
77th/ 347
METRIC RANK
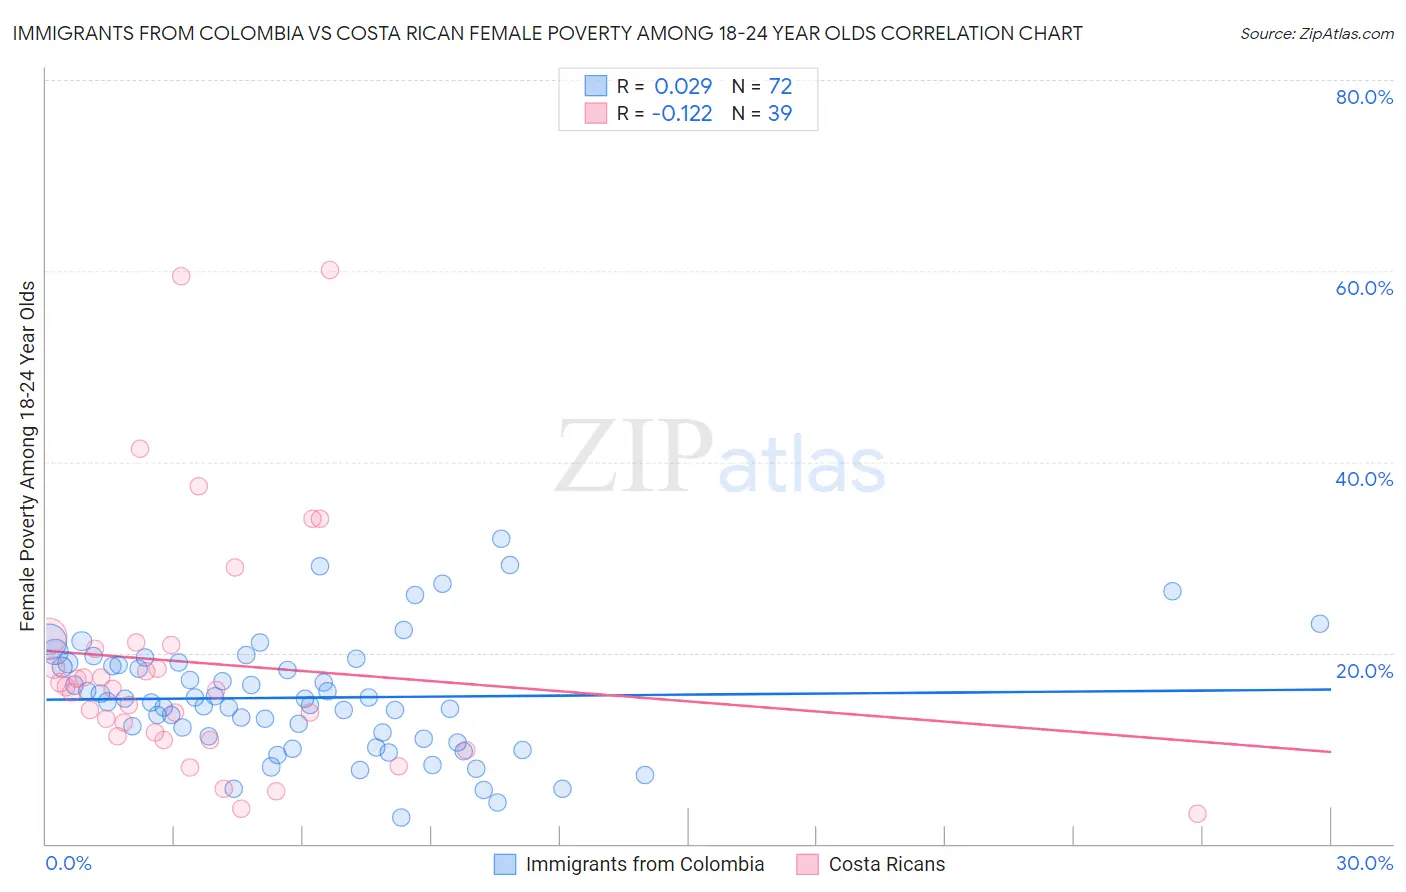
Immigrants from Colombia vs Costa Rican Female Poverty Among 18-24 Year Olds Correlation Chart
The statistical analysis conducted on geographies consisting of 369,842,642 people shows no correlation between the proportion of Immigrants from Colombia and poverty level among females between the ages 18 and 24 in the United States with a correlation coefficient (R) of 0.029 and weighted average of 17.3%. Similarly, the statistical analysis conducted on geographies consisting of 250,266,306 people shows a poor negative correlation between the proportion of Costa Ricans and poverty level among females between the ages 18 and 24 in the United States with a correlation coefficient (R) of -0.122 and weighted average of 18.8%, a difference of 8.4%.
Female Poverty Among 18-24 Year Olds Correlation Summary
| Measurement | Immigrants from Colombia | Costa Rican |
| Minimum | 2.8% | 3.1% |
| Maximum | 32.0% | 60.2% |
| Range | 29.2% | 57.0% |
| Mean | 15.3% | 18.9% |
| Median | 15.0% | 16.2% |
| Interquartile 25% (IQ1) | 11.2% | 11.2% |
| Interquartile 75% (IQ3) | 18.9% | 20.9% |
| Interquartile Range (IQR) | 7.7% | 9.7% |
| Standard Deviation (Sample) | 6.0% | 13.0% |
| Standard Deviation (Population) | 6.0% | 12.8% |
Similar Demographics by Female Poverty Among 18-24 Year Olds
Demographics Similar to Immigrants from Colombia by Female Poverty Among 18-24 Year Olds
In terms of female poverty among 18-24 year olds, the demographic groups most similar to Immigrants from Colombia are Immigrants from Lithuania (17.4%, a difference of 0.41%), Immigrants from Taiwan (17.3%, a difference of 0.46%), Immigrants from Venezuela (17.4%, a difference of 0.54%), Bolivian (17.4%, a difference of 0.54%), and Immigrants from Hong Kong (17.5%, a difference of 0.64%).
| Demographics | Rating | Rank | Female Poverty Among 18-24 Year Olds |
| Thais | 100.0 /100 | #11 | Exceptional 17.0% |
| Immigrants | Pakistan | 100.0 /100 | #12 | Exceptional 17.0% |
| Immigrants | Poland | 100.0 /100 | #13 | Exceptional 17.1% |
| Tongans | 100.0 /100 | #14 | Exceptional 17.1% |
| Cubans | 100.0 /100 | #15 | Exceptional 17.2% |
| Peruvians | 100.0 /100 | #16 | Exceptional 17.2% |
| Immigrants | Taiwan | 100.0 /100 | #17 | Exceptional 17.3% |
| Immigrants | Colombia | 100.0 /100 | #18 | Exceptional 17.3% |
| Immigrants | Lithuania | 100.0 /100 | #19 | Exceptional 17.4% |
| Immigrants | Venezuela | 100.0 /100 | #20 | Exceptional 17.4% |
| Bolivians | 100.0 /100 | #21 | Exceptional 17.4% |
| Immigrants | Hong Kong | 100.0 /100 | #22 | Exceptional 17.5% |
| Immigrants | North Macedonia | 100.0 /100 | #23 | Exceptional 17.6% |
| Maltese | 100.0 /100 | #24 | Exceptional 17.6% |
| Immigrants | South Central Asia | 100.0 /100 | #25 | Exceptional 17.6% |
Demographics Similar to Costa Ricans by Female Poverty Among 18-24 Year Olds
In terms of female poverty among 18-24 year olds, the demographic groups most similar to Costa Ricans are Immigrants from Europe (18.8%, a difference of 0.010%), Uruguayan (18.8%, a difference of 0.010%), Palestinian (18.8%, a difference of 0.090%), Japanese (18.8%, a difference of 0.090%), and Immigrants from Cambodia (18.8%, a difference of 0.10%).
| Demographics | Rating | Rank | Female Poverty Among 18-24 Year Olds |
| Immigrants | Costa Rica | 99.7 /100 | #70 | Exceptional 18.7% |
| Immigrants | Haiti | 99.7 /100 | #71 | Exceptional 18.7% |
| Armenians | 99.7 /100 | #72 | Exceptional 18.7% |
| Lithuanians | 99.7 /100 | #73 | Exceptional 18.7% |
| Hawaiians | 99.6 /100 | #74 | Exceptional 18.7% |
| Poles | 99.6 /100 | #75 | Exceptional 18.8% |
| Immigrants | Cambodia | 99.5 /100 | #76 | Exceptional 18.8% |
| Costa Ricans | 99.5 /100 | #77 | Exceptional 18.8% |
| Immigrants | Europe | 99.5 /100 | #78 | Exceptional 18.8% |
| Uruguayans | 99.5 /100 | #79 | Exceptional 18.8% |
| Palestinians | 99.5 /100 | #80 | Exceptional 18.8% |
| Japanese | 99.5 /100 | #81 | Exceptional 18.8% |
| Immigrants | Uruguay | 99.4 /100 | #82 | Exceptional 18.8% |
| Immigrants | Indonesia | 99.4 /100 | #83 | Exceptional 18.9% |
| Burmese | 99.2 /100 | #84 | Exceptional 18.9% |