Sioux vs Ottawa Single Male Poverty
COMPARE
Sioux
Ottawa
Single Male Poverty
Single Male Poverty Comparison
Sioux
Ottawa
22.2%
SINGLE MALE POVERTY
0.0/ 100
METRIC RATING
340th/ 347
METRIC RANK
14.6%
SINGLE MALE POVERTY
0.0/ 100
METRIC RATING
294th/ 347
METRIC RANK
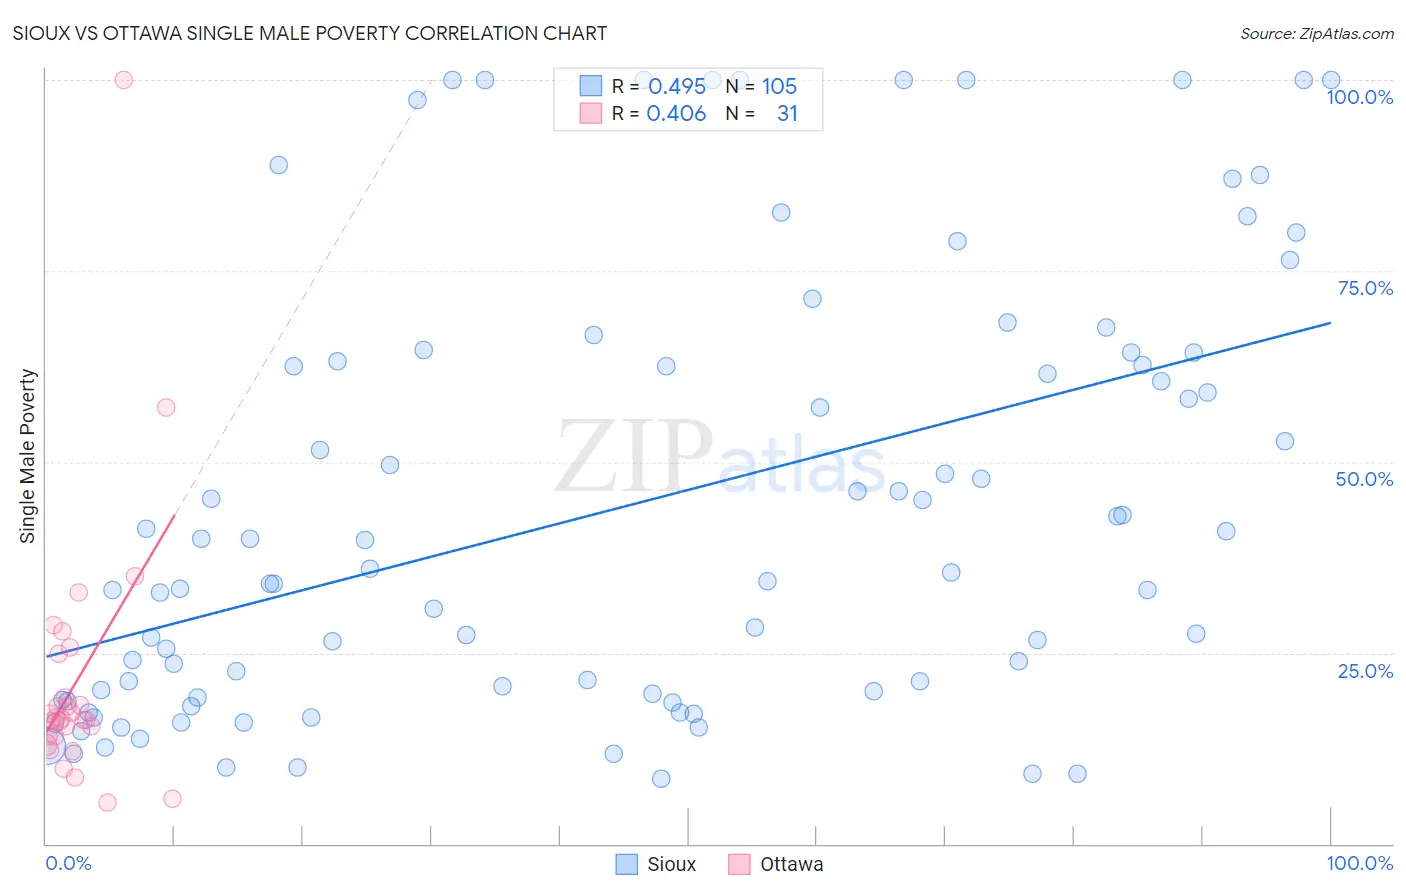
Sioux vs Ottawa Single Male Poverty Correlation Chart
The statistical analysis conducted on geographies consisting of 217,135,465 people shows a moderate positive correlation between the proportion of Sioux and poverty level among single males in the United States with a correlation coefficient (R) of 0.495 and weighted average of 22.2%. Similarly, the statistical analysis conducted on geographies consisting of 47,840,673 people shows a moderate positive correlation between the proportion of Ottawa and poverty level among single males in the United States with a correlation coefficient (R) of 0.406 and weighted average of 14.6%, a difference of 52.0%.
Single Male Poverty Correlation Summary
| Measurement | Sioux | Ottawa |
| Minimum | 8.6% | 5.4% |
| Maximum | 100.0% | 100.0% |
| Range | 91.4% | 94.6% |
| Mean | 44.2% | 21.4% |
| Median | 35.5% | 16.3% |
| Interquartile 25% (IQ1) | 19.4% | 14.0% |
| Interquartile 75% (IQ3) | 63.7% | 24.9% |
| Interquartile Range (IQR) | 44.3% | 10.9% |
| Standard Deviation (Sample) | 28.5% | 17.7% |
| Standard Deviation (Population) | 28.4% | 17.4% |
Similar Demographics by Single Male Poverty
Demographics Similar to Sioux by Single Male Poverty
In terms of single male poverty, the demographic groups most similar to Sioux are Arapaho (21.9%, a difference of 1.3%), Pueblo (21.6%, a difference of 2.8%), Apache (21.6%, a difference of 2.9%), Tohono O'odham (21.6%, a difference of 3.1%), and Yuman (21.3%, a difference of 4.3%).
| Demographics | Rating | Rank | Single Male Poverty |
| Inupiat | 0.0 /100 | #333 | Tragic 20.0% |
| Pima | 0.0 /100 | #334 | Tragic 20.2% |
| Yuman | 0.0 /100 | #335 | Tragic 21.3% |
| Tohono O'odham | 0.0 /100 | #336 | Tragic 21.6% |
| Apache | 0.0 /100 | #337 | Tragic 21.6% |
| Pueblo | 0.0 /100 | #338 | Tragic 21.6% |
| Arapaho | 0.0 /100 | #339 | Tragic 21.9% |
| Sioux | 0.0 /100 | #340 | Tragic 22.2% |
| Crow | 0.0 /100 | #341 | Tragic 23.3% |
| Houma | 0.0 /100 | #342 | Tragic 23.5% |
| Puerto Ricans | 0.0 /100 | #343 | Tragic 25.1% |
| Lumbee | 0.0 /100 | #344 | Tragic 25.2% |
| Navajo | 0.0 /100 | #345 | Tragic 25.3% |
| Hopi | 0.0 /100 | #346 | Tragic 27.5% |
| Yup'ik | 0.0 /100 | #347 | Tragic 31.6% |
Demographics Similar to Ottawa by Single Male Poverty
In terms of single male poverty, the demographic groups most similar to Ottawa are French Canadian (14.6%, a difference of 0.19%), Nonimmigrants (14.6%, a difference of 0.30%), Bahamian (14.6%, a difference of 0.43%), Scotch-Irish (14.7%, a difference of 0.44%), and U.S. Virgin Islander (14.5%, a difference of 0.59%).
| Demographics | Rating | Rank | Single Male Poverty |
| Iroquois | 0.0 /100 | #287 | Tragic 14.5% |
| Whites/Caucasians | 0.0 /100 | #288 | Tragic 14.5% |
| Immigrants | Dominica | 0.0 /100 | #289 | Tragic 14.5% |
| U.S. Virgin Islanders | 0.0 /100 | #290 | Tragic 14.5% |
| Bahamians | 0.0 /100 | #291 | Tragic 14.6% |
| Immigrants | Nonimmigrants | 0.0 /100 | #292 | Tragic 14.6% |
| French Canadians | 0.0 /100 | #293 | Tragic 14.6% |
| Ottawa | 0.0 /100 | #294 | Tragic 14.6% |
| Scotch-Irish | 0.0 /100 | #295 | Tragic 14.7% |
| Africans | 0.0 /100 | #296 | Tragic 14.7% |
| Immigrants | Dominican Republic | 0.0 /100 | #297 | Tragic 14.8% |
| French American Indians | 0.0 /100 | #298 | Tragic 15.0% |
| Delaware | 0.0 /100 | #299 | Tragic 15.0% |
| Cree | 0.0 /100 | #300 | Tragic 15.1% |
| Dominicans | 0.0 /100 | #301 | Tragic 15.2% |