Sierra Leonean vs Immigrants from Morocco Child Poverty Under the Age of 5
COMPARE
Sierra Leonean
Immigrants from Morocco
Child Poverty Under the Age of 5
Child Poverty Under the Age of 5 Comparison
Sierra Leoneans
Immigrants from Morocco
17.7%
CHILD POVERTY UNDER THE AGE OF 5
24.1/ 100
METRIC RATING
195th/ 347
METRIC RANK
17.1%
CHILD POVERTY UNDER THE AGE OF 5
58.9/ 100
METRIC RATING
171st/ 347
METRIC RANK
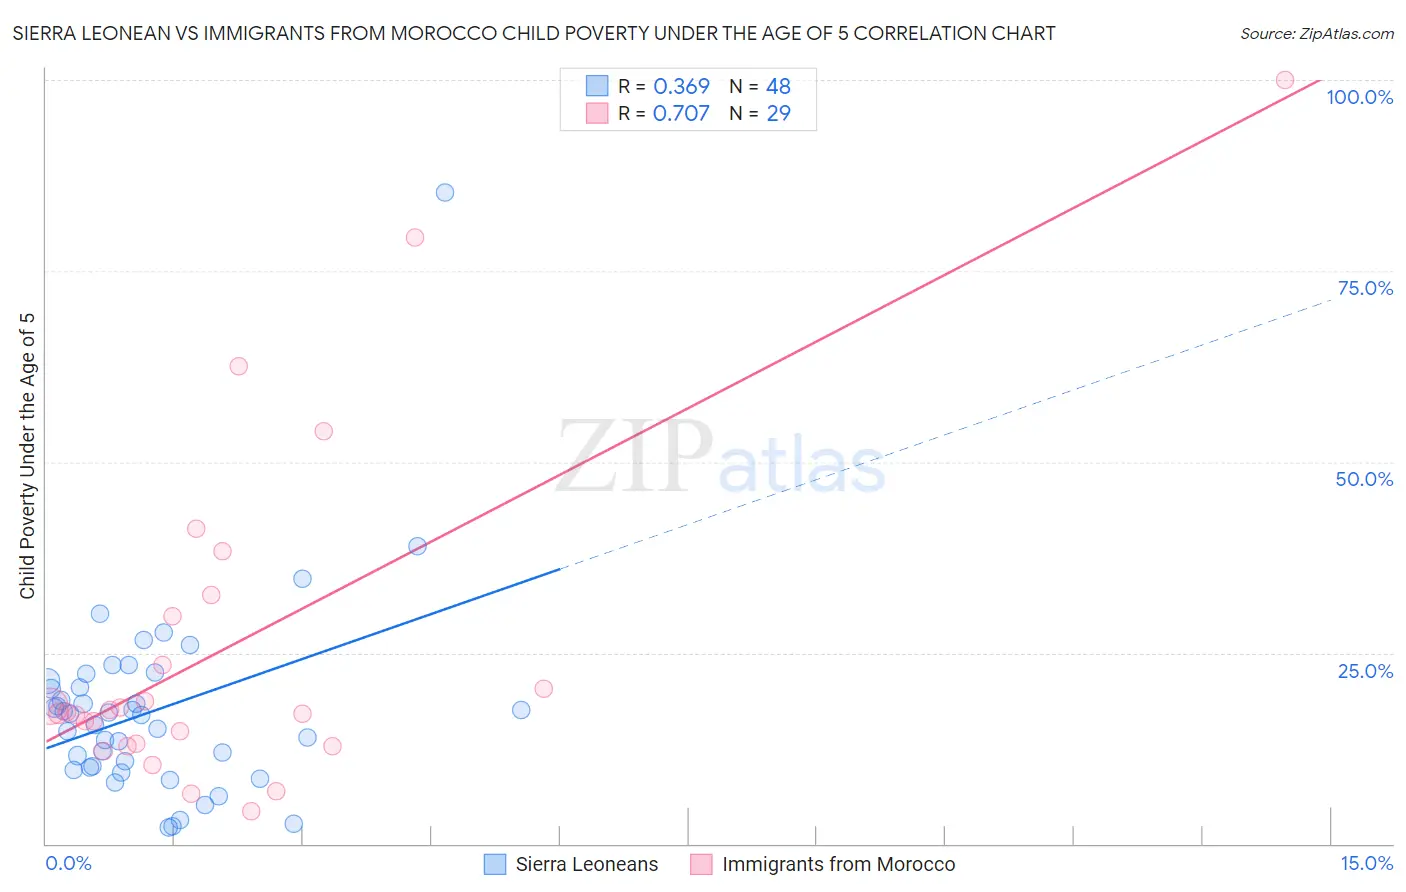
Sierra Leonean vs Immigrants from Morocco Child Poverty Under the Age of 5 Correlation Chart
The statistical analysis conducted on geographies consisting of 82,787,385 people shows a mild positive correlation between the proportion of Sierra Leoneans and poverty level among children under the age of 5 in the United States with a correlation coefficient (R) of 0.369 and weighted average of 17.7%. Similarly, the statistical analysis conducted on geographies consisting of 175,526,639 people shows a strong positive correlation between the proportion of Immigrants from Morocco and poverty level among children under the age of 5 in the United States with a correlation coefficient (R) of 0.707 and weighted average of 17.1%, a difference of 4.0%.
Child Poverty Under the Age of 5 Correlation Summary
| Measurement | Sierra Leonean | Immigrants from Morocco |
| Minimum | 2.1% | 4.3% |
| Maximum | 85.3% | 100.0% |
| Range | 83.2% | 95.7% |
| Mean | 17.4% | 25.8% |
| Median | 16.9% | 17.2% |
| Interquartile 25% (IQ1) | 10.1% | 13.0% |
| Interquartile 75% (IQ3) | 20.8% | 31.2% |
| Interquartile Range (IQR) | 10.8% | 18.2% |
| Standard Deviation (Sample) | 12.9% | 22.4% |
| Standard Deviation (Population) | 12.7% | 22.0% |
Similar Demographics by Child Poverty Under the Age of 5
Demographics Similar to Sierra Leoneans by Child Poverty Under the Age of 5
In terms of child poverty under the age of 5, the demographic groups most similar to Sierra Leoneans are French Canadian (17.7%, a difference of 0.070%), Immigrants from Uganda (17.7%, a difference of 0.12%), Immigrants from Portugal (17.8%, a difference of 0.27%), Immigrants from Uruguay (17.7%, a difference of 0.49%), and Immigrants from Afghanistan (17.7%, a difference of 0.50%).
| Demographics | Rating | Rank | Child Poverty Under the Age of 5 |
| Carpatho Rusyns | 33.6 /100 | #188 | Fair 17.5% |
| French | 33.6 /100 | #189 | Fair 17.5% |
| Slovaks | 29.2 /100 | #190 | Fair 17.6% |
| Immigrants | Afghanistan | 27.9 /100 | #191 | Fair 17.7% |
| Immigrants | Uruguay | 27.8 /100 | #192 | Fair 17.7% |
| Immigrants | Uganda | 25.0 /100 | #193 | Fair 17.7% |
| French Canadians | 24.6 /100 | #194 | Fair 17.7% |
| Sierra Leoneans | 24.1 /100 | #195 | Fair 17.7% |
| Immigrants | Portugal | 22.2 /100 | #196 | Fair 17.8% |
| Immigrants | Kenya | 20.0 /100 | #197 | Fair 17.9% |
| Celtics | 18.3 /100 | #198 | Poor 17.9% |
| Hungarians | 18.3 /100 | #199 | Poor 17.9% |
| Iraqis | 14.0 /100 | #200 | Poor 18.0% |
| Ugandans | 13.9 /100 | #201 | Poor 18.0% |
| Japanese | 13.8 /100 | #202 | Poor 18.1% |
Demographics Similar to Immigrants from Morocco by Child Poverty Under the Age of 5
In terms of child poverty under the age of 5, the demographic groups most similar to Immigrants from Morocco are Immigrants from Western Asia (17.1%, a difference of 0.030%), Immigrants from South America (17.1%, a difference of 0.12%), Uruguayan (17.0%, a difference of 0.17%), Immigrants from Uzbekistan (17.0%, a difference of 0.33%), and Yugoslavian (17.2%, a difference of 0.51%).
| Demographics | Rating | Rank | Child Poverty Under the Age of 5 |
| Immigrants | Oceania | 67.6 /100 | #164 | Good 16.9% |
| Immigrants | Colombia | 66.9 /100 | #165 | Good 16.9% |
| Slavs | 64.0 /100 | #166 | Good 17.0% |
| Immigrants | Uzbekistan | 62.0 /100 | #167 | Good 17.0% |
| Uruguayans | 60.5 /100 | #168 | Good 17.0% |
| Immigrants | South America | 60.0 /100 | #169 | Good 17.1% |
| Immigrants | Western Asia | 59.2 /100 | #170 | Average 17.1% |
| Immigrants | Morocco | 58.9 /100 | #171 | Average 17.1% |
| Yugoslavians | 54.1 /100 | #172 | Average 17.2% |
| Welsh | 54.0 /100 | #173 | Average 17.2% |
| Immigrants | Saudi Arabia | 50.0 /100 | #174 | Average 17.2% |
| Immigrants | Lebanon | 47.6 /100 | #175 | Average 17.3% |
| Immigrants | Iraq | 45.2 /100 | #176 | Average 17.3% |
| Immigrants | Sierra Leone | 43.6 /100 | #177 | Average 17.3% |
| Immigrants | Cameroon | 42.7 /100 | #178 | Average 17.4% |