Sierra Leonean vs Immigrants from Czechoslovakia Child Poverty Under the Age of 5
COMPARE
Sierra Leonean
Immigrants from Czechoslovakia
Child Poverty Under the Age of 5
Child Poverty Under the Age of 5 Comparison
Sierra Leoneans
Immigrants from Czechoslovakia
17.7%
CHILD POVERTY UNDER THE AGE OF 5
24.1/ 100
METRIC RATING
195th/ 347
METRIC RANK
14.8%
CHILD POVERTY UNDER THE AGE OF 5
99.6/ 100
METRIC RATING
48th/ 347
METRIC RANK
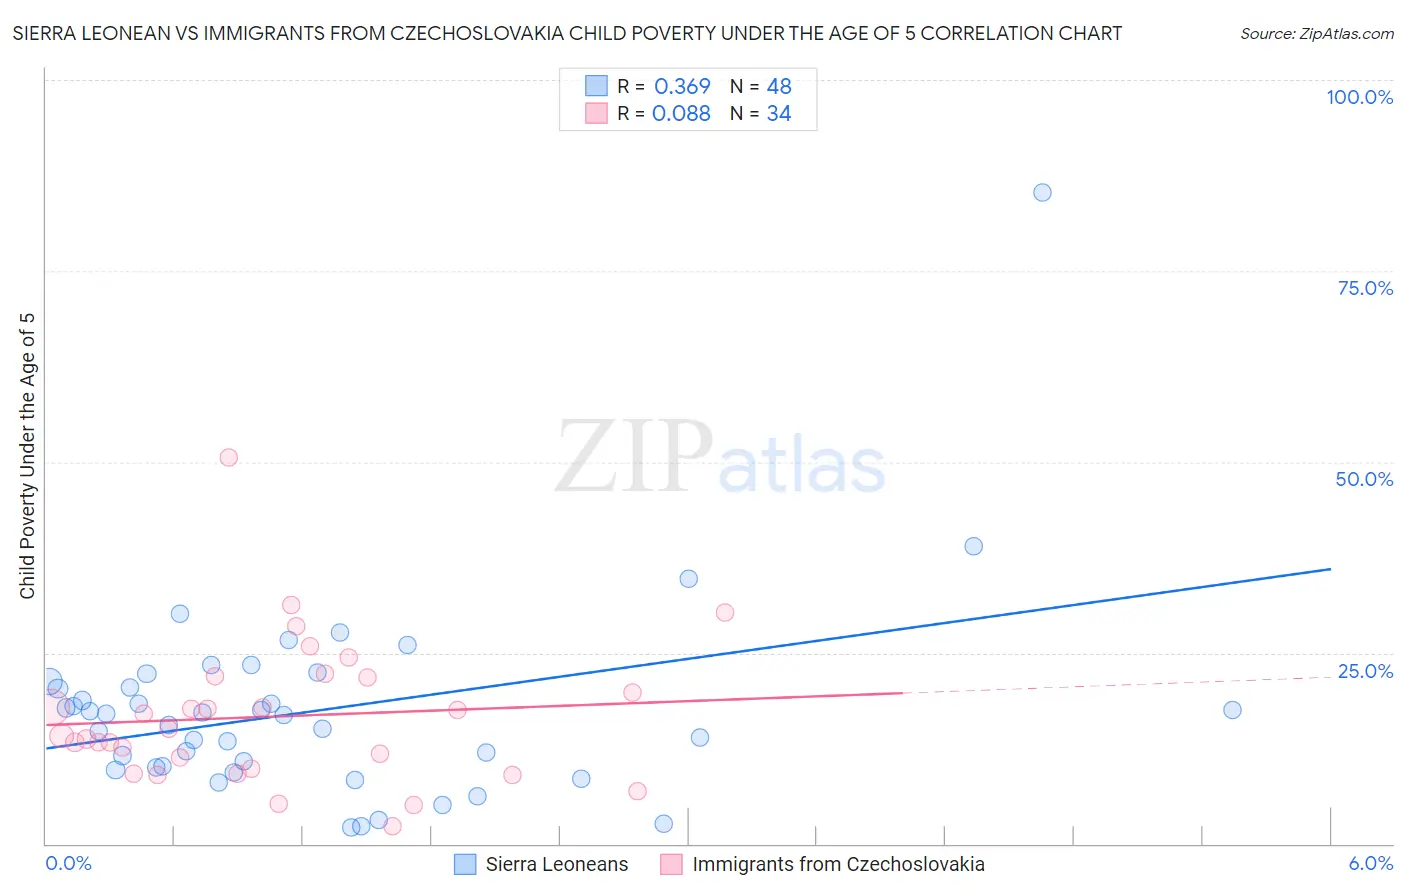
Sierra Leonean vs Immigrants from Czechoslovakia Child Poverty Under the Age of 5 Correlation Chart
The statistical analysis conducted on geographies consisting of 82,787,385 people shows a mild positive correlation between the proportion of Sierra Leoneans and poverty level among children under the age of 5 in the United States with a correlation coefficient (R) of 0.369 and weighted average of 17.7%. Similarly, the statistical analysis conducted on geographies consisting of 189,024,563 people shows a slight positive correlation between the proportion of Immigrants from Czechoslovakia and poverty level among children under the age of 5 in the United States with a correlation coefficient (R) of 0.088 and weighted average of 14.8%, a difference of 20.2%.
Child Poverty Under the Age of 5 Correlation Summary
| Measurement | Sierra Leonean | Immigrants from Czechoslovakia |
| Minimum | 2.1% | 2.3% |
| Maximum | 85.3% | 50.5% |
| Range | 83.2% | 48.2% |
| Mean | 17.4% | 16.7% |
| Median | 16.9% | 14.5% |
| Interquartile 25% (IQ1) | 10.1% | 9.8% |
| Interquartile 75% (IQ3) | 20.8% | 21.8% |
| Interquartile Range (IQR) | 10.8% | 12.1% |
| Standard Deviation (Sample) | 12.9% | 9.4% |
| Standard Deviation (Population) | 12.7% | 9.2% |
Similar Demographics by Child Poverty Under the Age of 5
Demographics Similar to Sierra Leoneans by Child Poverty Under the Age of 5
In terms of child poverty under the age of 5, the demographic groups most similar to Sierra Leoneans are French Canadian (17.7%, a difference of 0.070%), Immigrants from Uganda (17.7%, a difference of 0.12%), Immigrants from Portugal (17.8%, a difference of 0.27%), Immigrants from Uruguay (17.7%, a difference of 0.49%), and Immigrants from Afghanistan (17.7%, a difference of 0.50%).
| Demographics | Rating | Rank | Child Poverty Under the Age of 5 |
| Carpatho Rusyns | 33.6 /100 | #188 | Fair 17.5% |
| French | 33.6 /100 | #189 | Fair 17.5% |
| Slovaks | 29.2 /100 | #190 | Fair 17.6% |
| Immigrants | Afghanistan | 27.9 /100 | #191 | Fair 17.7% |
| Immigrants | Uruguay | 27.8 /100 | #192 | Fair 17.7% |
| Immigrants | Uganda | 25.0 /100 | #193 | Fair 17.7% |
| French Canadians | 24.6 /100 | #194 | Fair 17.7% |
| Sierra Leoneans | 24.1 /100 | #195 | Fair 17.7% |
| Immigrants | Portugal | 22.2 /100 | #196 | Fair 17.8% |
| Immigrants | Kenya | 20.0 /100 | #197 | Fair 17.9% |
| Celtics | 18.3 /100 | #198 | Poor 17.9% |
| Hungarians | 18.3 /100 | #199 | Poor 17.9% |
| Iraqis | 14.0 /100 | #200 | Poor 18.0% |
| Ugandans | 13.9 /100 | #201 | Poor 18.0% |
| Japanese | 13.8 /100 | #202 | Poor 18.1% |
Demographics Similar to Immigrants from Czechoslovakia by Child Poverty Under the Age of 5
In terms of child poverty under the age of 5, the demographic groups most similar to Immigrants from Czechoslovakia are Russian (14.8%, a difference of 0.11%), Immigrants from Bulgaria (14.8%, a difference of 0.15%), Tsimshian (14.7%, a difference of 0.24%), Immigrants from Northern Europe (14.8%, a difference of 0.24%), and Estonian (14.8%, a difference of 0.29%).
| Demographics | Rating | Rank | Child Poverty Under the Age of 5 |
| Immigrants | Belarus | 99.7 /100 | #41 | Exceptional 14.7% |
| Soviet Union | 99.7 /100 | #42 | Exceptional 14.7% |
| Immigrants | Greece | 99.7 /100 | #43 | Exceptional 14.7% |
| Immigrants | Philippines | 99.7 /100 | #44 | Exceptional 14.7% |
| Laotians | 99.6 /100 | #45 | Exceptional 14.7% |
| Tsimshian | 99.6 /100 | #46 | Exceptional 14.7% |
| Russians | 99.6 /100 | #47 | Exceptional 14.8% |
| Immigrants | Czechoslovakia | 99.6 /100 | #48 | Exceptional 14.8% |
| Immigrants | Bulgaria | 99.6 /100 | #49 | Exceptional 14.8% |
| Immigrants | Northern Europe | 99.6 /100 | #50 | Exceptional 14.8% |
| Estonians | 99.6 /100 | #51 | Exceptional 14.8% |
| Immigrants | Serbia | 99.5 /100 | #52 | Exceptional 14.9% |
| Luxembourgers | 99.4 /100 | #53 | Exceptional 14.9% |
| Immigrants | Israel | 99.4 /100 | #54 | Exceptional 14.9% |
| Danes | 99.4 /100 | #55 | Exceptional 14.9% |