Shoshone vs Ute Child Poverty Among Boys Under 16
COMPARE
Shoshone
Ute
Child Poverty Among Boys Under 16
Child Poverty Among Boys Under 16 Comparison
Shoshone
Ute
19.4%
CHILD POVERTY AMONG BOYS UNDER 16
0.2/ 100
METRIC RATING
260th/ 347
METRIC RANK
21.6%
CHILD POVERTY AMONG BOYS UNDER 16
0.0/ 100
METRIC RATING
314th/ 347
METRIC RANK
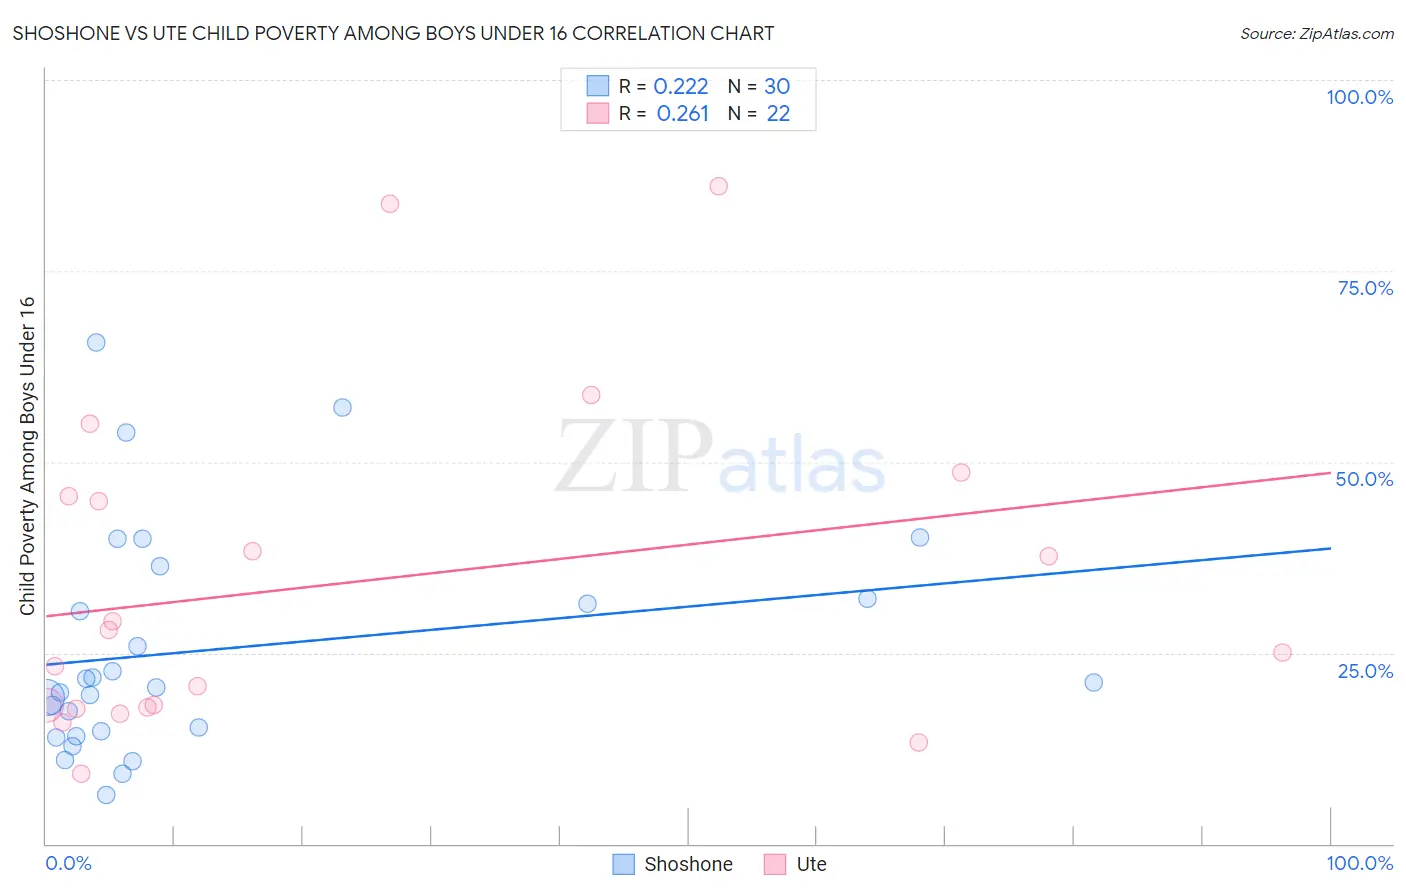
Shoshone vs Ute Child Poverty Among Boys Under 16 Correlation Chart
The statistical analysis conducted on geographies consisting of 66,418,613 people shows a weak positive correlation between the proportion of Shoshone and poverty level among boys under the age of 16 in the United States with a correlation coefficient (R) of 0.222 and weighted average of 19.4%. Similarly, the statistical analysis conducted on geographies consisting of 55,537,245 people shows a weak positive correlation between the proportion of Ute and poverty level among boys under the age of 16 in the United States with a correlation coefficient (R) of 0.261 and weighted average of 21.6%, a difference of 11.3%.
Child Poverty Among Boys Under 16 Correlation Summary
| Measurement | Shoshone | Ute |
| Minimum | 6.3% | 9.2% |
| Maximum | 65.6% | 86.0% |
| Range | 59.3% | 76.9% |
| Mean | 25.4% | 34.2% |
| Median | 20.8% | 26.5% |
| Interquartile 25% (IQ1) | 14.7% | 17.8% |
| Interquartile 75% (IQ3) | 32.0% | 45.5% |
| Interquartile Range (IQR) | 17.3% | 27.7% |
| Standard Deviation (Sample) | 14.7% | 21.7% |
| Standard Deviation (Population) | 14.5% | 21.2% |
Similar Demographics by Child Poverty Among Boys Under 16
Demographics Similar to Shoshone by Child Poverty Among Boys Under 16
In terms of child poverty among boys under 16, the demographic groups most similar to Shoshone are Immigrants from Ghana (19.4%, a difference of 0.010%), Spanish American (19.4%, a difference of 0.10%), Potawatomi (19.4%, a difference of 0.12%), Mexican American Indian (19.4%, a difference of 0.13%), and Immigrants from Liberia (19.3%, a difference of 0.34%).
| Demographics | Rating | Rank | Child Poverty Among Boys Under 16 |
| Liberians | 0.2 /100 | #253 | Tragic 19.3% |
| Trinidadians and Tobagonians | 0.2 /100 | #254 | Tragic 19.3% |
| Ecuadorians | 0.2 /100 | #255 | Tragic 19.3% |
| Immigrants | Liberia | 0.2 /100 | #256 | Tragic 19.3% |
| Mexican American Indians | 0.2 /100 | #257 | Tragic 19.4% |
| Potawatomi | 0.2 /100 | #258 | Tragic 19.4% |
| Spanish Americans | 0.2 /100 | #259 | Tragic 19.4% |
| Shoshone | 0.2 /100 | #260 | Tragic 19.4% |
| Immigrants | Ghana | 0.2 /100 | #261 | Tragic 19.4% |
| Immigrants | Guyana | 0.1 /100 | #262 | Tragic 19.5% |
| Ottawa | 0.1 /100 | #263 | Tragic 19.5% |
| Iroquois | 0.1 /100 | #264 | Tragic 19.6% |
| Guyanese | 0.1 /100 | #265 | Tragic 19.6% |
| Immigrants | El Salvador | 0.1 /100 | #266 | Tragic 19.6% |
| Vietnamese | 0.1 /100 | #267 | Tragic 19.6% |
Demographics Similar to Ute by Child Poverty Among Boys Under 16
In terms of child poverty among boys under 16, the demographic groups most similar to Ute are British West Indian (21.6%, a difference of 0.010%), Immigrants from Guatemala (21.6%, a difference of 0.020%), Bahamian (21.6%, a difference of 0.10%), Creek (21.5%, a difference of 0.21%), and Seminole (21.5%, a difference of 0.27%).
| Demographics | Rating | Rank | Child Poverty Among Boys Under 16 |
| Choctaw | 0.0 /100 | #307 | Tragic 21.3% |
| Immigrants | Mexico | 0.0 /100 | #308 | Tragic 21.5% |
| Seminole | 0.0 /100 | #309 | Tragic 21.5% |
| Creek | 0.0 /100 | #310 | Tragic 21.5% |
| Bahamians | 0.0 /100 | #311 | Tragic 21.6% |
| Immigrants | Guatemala | 0.0 /100 | #312 | Tragic 21.6% |
| British West Indians | 0.0 /100 | #313 | Tragic 21.6% |
| Ute | 0.0 /100 | #314 | Tragic 21.6% |
| Immigrants | Somalia | 0.0 /100 | #315 | Tragic 21.7% |
| Menominee | 0.0 /100 | #316 | Tragic 21.7% |
| Africans | 0.0 /100 | #317 | Tragic 21.7% |
| Yakama | 0.0 /100 | #318 | Tragic 21.7% |
| Dutch West Indians | 0.0 /100 | #319 | Tragic 21.8% |
| U.S. Virgin Islanders | 0.0 /100 | #320 | Tragic 22.0% |
| Cajuns | 0.0 /100 | #321 | Tragic 22.2% |