Shoshone vs Immigrants from Iran Family Poverty
COMPARE
Shoshone
Immigrants from Iran
Family Poverty
Family Poverty Comparison
Shoshone
Immigrants from Iran
10.9%
FAMILY POVERTY
0.2/ 100
METRIC RATING
261st/ 347
METRIC RANK
7.3%
FAMILY POVERTY
99.7/ 100
METRIC RATING
21st/ 347
METRIC RANK
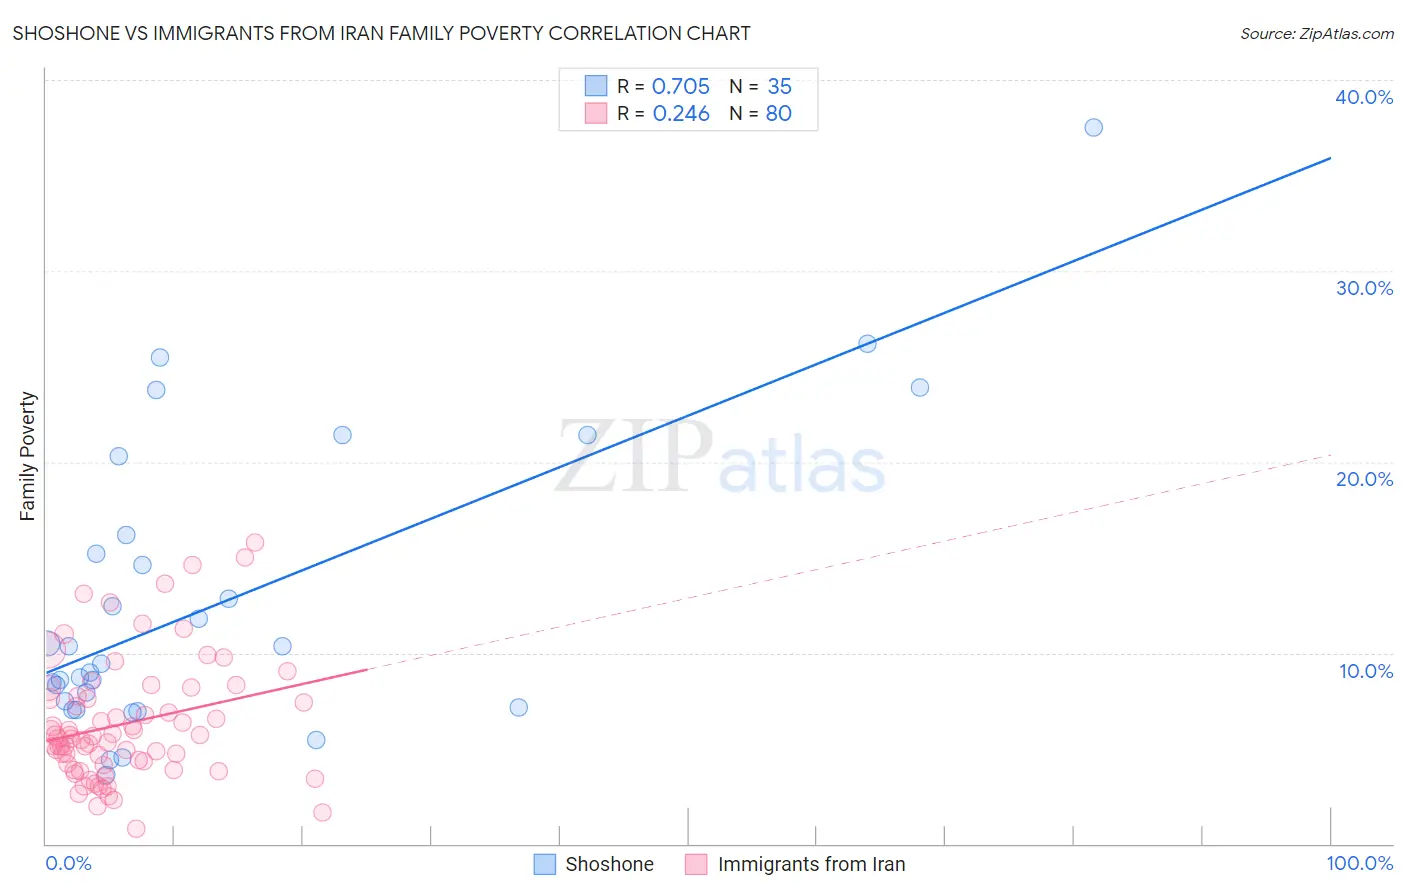
Shoshone vs Immigrants from Iran Family Poverty Correlation Chart
The statistical analysis conducted on geographies consisting of 66,600,445 people shows a strong positive correlation between the proportion of Shoshone and poverty level among families in the United States with a correlation coefficient (R) of 0.705 and weighted average of 10.9%. Similarly, the statistical analysis conducted on geographies consisting of 279,394,600 people shows a weak positive correlation between the proportion of Immigrants from Iran and poverty level among families in the United States with a correlation coefficient (R) of 0.246 and weighted average of 7.3%, a difference of 49.9%.
Family Poverty Correlation Summary
| Measurement | Shoshone | Immigrants from Iran |
| Minimum | 3.6% | 0.76% |
| Maximum | 37.5% | 15.8% |
| Range | 33.9% | 15.0% |
| Mean | 12.7% | 6.3% |
| Median | 9.4% | 5.6% |
| Interquartile 25% (IQ1) | 7.1% | 4.2% |
| Interquartile 75% (IQ3) | 16.2% | 7.7% |
| Interquartile Range (IQR) | 9.0% | 3.5% |
| Standard Deviation (Sample) | 7.8% | 3.2% |
| Standard Deviation (Population) | 7.7% | 3.2% |
Similar Demographics by Family Poverty
Demographics Similar to Shoshone by Family Poverty
In terms of family poverty, the demographic groups most similar to Shoshone are Bangladeshi (10.9%, a difference of 0.030%), Spanish American Indian (10.9%, a difference of 0.13%), Mexican American Indian (10.9%, a difference of 0.38%), Cape Verdean (10.9%, a difference of 0.39%), and Trinidadian and Tobagonian (10.9%, a difference of 0.41%).
| Demographics | Rating | Rank | Family Poverty |
| Ecuadorians | 0.2 /100 | #254 | Tragic 10.8% |
| Immigrants | Liberia | 0.2 /100 | #255 | Tragic 10.8% |
| Chickasaw | 0.2 /100 | #256 | Tragic 10.8% |
| Immigrants | Ghana | 0.2 /100 | #257 | Tragic 10.8% |
| Sub-Saharan Africans | 0.2 /100 | #258 | Tragic 10.9% |
| Mexican American Indians | 0.2 /100 | #259 | Tragic 10.9% |
| Bangladeshis | 0.2 /100 | #260 | Tragic 10.9% |
| Shoshone | 0.2 /100 | #261 | Tragic 10.9% |
| Spanish American Indians | 0.2 /100 | #262 | Tragic 10.9% |
| Cape Verdeans | 0.1 /100 | #263 | Tragic 10.9% |
| Trinidadians and Tobagonians | 0.1 /100 | #264 | Tragic 10.9% |
| Immigrants | Trinidad and Tobago | 0.1 /100 | #265 | Tragic 10.9% |
| Immigrants | El Salvador | 0.1 /100 | #266 | Tragic 11.0% |
| Comanche | 0.1 /100 | #267 | Tragic 11.0% |
| Jamaicans | 0.1 /100 | #268 | Tragic 11.1% |
Demographics Similar to Immigrants from Iran by Family Poverty
In terms of family poverty, the demographic groups most similar to Immigrants from Iran are Immigrants from Hong Kong (7.3%, a difference of 0.20%), Eastern European (7.2%, a difference of 0.36%), Danish (7.3%, a difference of 0.44%), Assyrian/Chaldean/Syriac (7.3%, a difference of 0.45%), and Immigrants from Lithuania (7.2%, a difference of 0.67%).
| Demographics | Rating | Rank | Family Poverty |
| Iranians | 99.8 /100 | #14 | Exceptional 7.1% |
| Lithuanians | 99.8 /100 | #15 | Exceptional 7.2% |
| Immigrants | South Central Asia | 99.8 /100 | #16 | Exceptional 7.2% |
| Luxembourgers | 99.8 /100 | #17 | Exceptional 7.2% |
| Immigrants | Lithuania | 99.8 /100 | #18 | Exceptional 7.2% |
| Eastern Europeans | 99.7 /100 | #19 | Exceptional 7.2% |
| Immigrants | Hong Kong | 99.7 /100 | #20 | Exceptional 7.3% |
| Immigrants | Iran | 99.7 /100 | #21 | Exceptional 7.3% |
| Danes | 99.7 /100 | #22 | Exceptional 7.3% |
| Assyrians/Chaldeans/Syriacs | 99.7 /100 | #23 | Exceptional 7.3% |
| Croatians | 99.7 /100 | #24 | Exceptional 7.3% |
| Burmese | 99.7 /100 | #25 | Exceptional 7.3% |
| Cypriots | 99.6 /100 | #26 | Exceptional 7.3% |
| Immigrants | Scotland | 99.6 /100 | #27 | Exceptional 7.3% |
| Immigrants | Korea | 99.6 /100 | #28 | Exceptional 7.4% |