Shoshone vs Immigrants from Chile Female Poverty Among 25-34 Year Olds
COMPARE
Shoshone
Immigrants from Chile
Female Poverty Among 25-34 Year Olds
Female Poverty Among 25-34 Year Olds Comparison
Shoshone
Immigrants from Chile
16.2%
FEMALE POVERTY AMONG 25-34 YEAR OLDS
0.0/ 100
METRIC RATING
284th/ 347
METRIC RANK
13.1%
FEMALE POVERTY AMONG 25-34 YEAR OLDS
84.6/ 100
METRIC RATING
137th/ 347
METRIC RANK
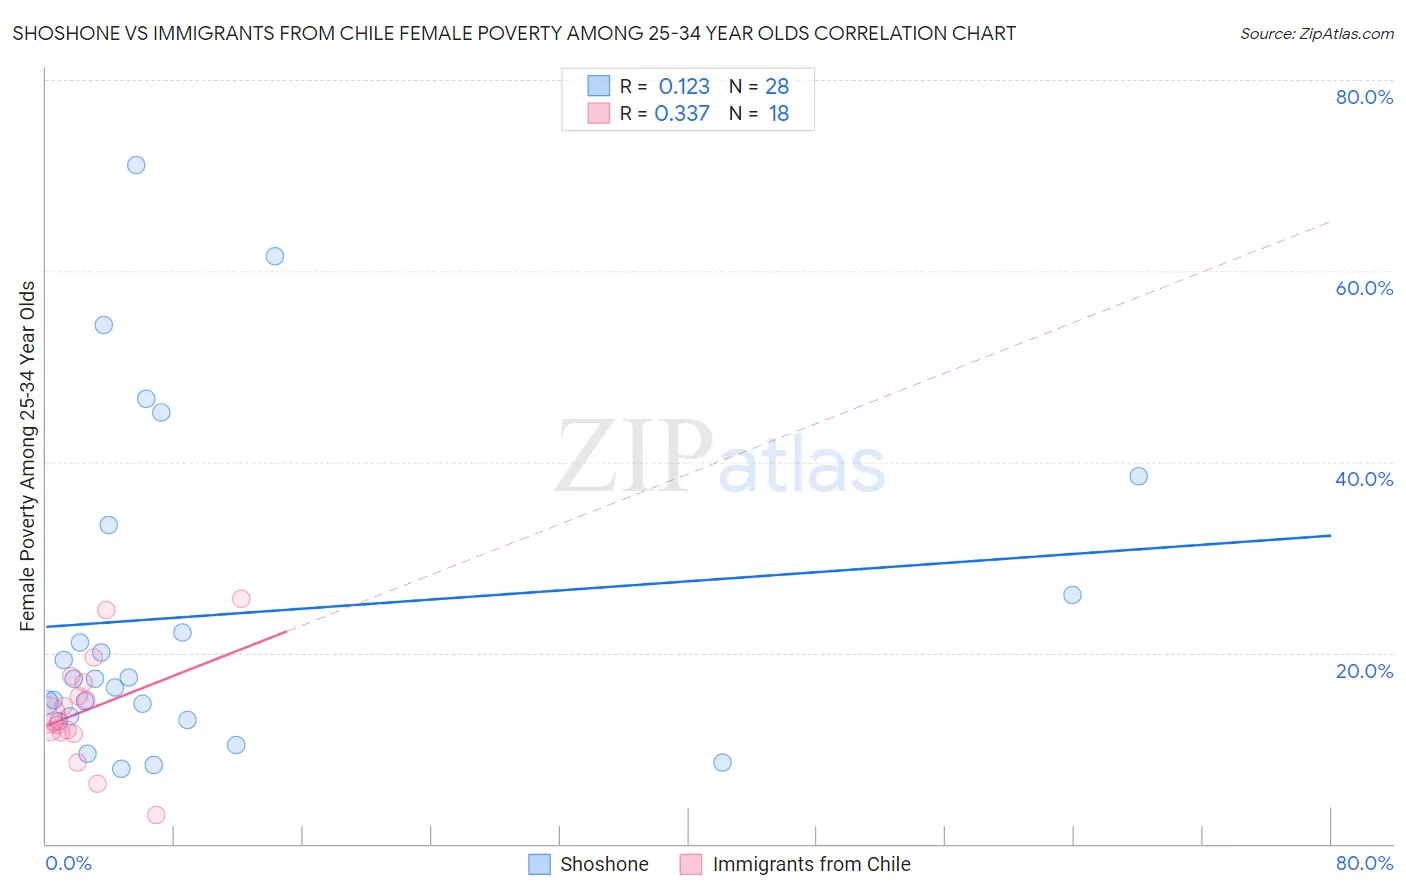
Shoshone vs Immigrants from Chile Female Poverty Among 25-34 Year Olds Correlation Chart
The statistical analysis conducted on geographies consisting of 66,384,090 people shows a poor positive correlation between the proportion of Shoshone and poverty level among females between the ages 25 and 34 in the United States with a correlation coefficient (R) of 0.123 and weighted average of 16.2%. Similarly, the statistical analysis conducted on geographies consisting of 216,631,317 people shows a mild positive correlation between the proportion of Immigrants from Chile and poverty level among females between the ages 25 and 34 in the United States with a correlation coefficient (R) of 0.337 and weighted average of 13.1%, a difference of 24.4%.
Female Poverty Among 25-34 Year Olds Correlation Summary
| Measurement | Shoshone | Immigrants from Chile |
| Minimum | 7.9% | 3.1% |
| Maximum | 71.1% | 25.7% |
| Range | 63.3% | 22.6% |
| Mean | 24.0% | 14.0% |
| Median | 17.3% | 13.2% |
| Interquartile 25% (IQ1) | 13.1% | 11.7% |
| Interquartile 75% (IQ3) | 29.7% | 16.9% |
| Interquartile Range (IQR) | 16.6% | 5.2% |
| Standard Deviation (Sample) | 17.1% | 5.6% |
| Standard Deviation (Population) | 16.8% | 5.5% |
Similar Demographics by Female Poverty Among 25-34 Year Olds
Demographics Similar to Shoshone by Female Poverty Among 25-34 Year Olds
In terms of female poverty among 25-34 year olds, the demographic groups most similar to Shoshone are Immigrants from Bahamas (16.3%, a difference of 0.50%), Cape Verdean (16.3%, a difference of 0.68%), American (16.4%, a difference of 0.73%), Bahamian (16.1%, a difference of 0.83%), and Aleut (16.1%, a difference of 0.87%).
| Demographics | Rating | Rank | Female Poverty Among 25-34 Year Olds |
| Immigrants | Micronesia | 0.0 /100 | #277 | Tragic 15.8% |
| French American Indians | 0.0 /100 | #278 | Tragic 15.9% |
| Fijians | 0.0 /100 | #279 | Tragic 15.9% |
| Bangladeshis | 0.0 /100 | #280 | Tragic 15.9% |
| Immigrants | Latin America | 0.0 /100 | #281 | Tragic 16.0% |
| Aleuts | 0.0 /100 | #282 | Tragic 16.1% |
| Bahamians | 0.0 /100 | #283 | Tragic 16.1% |
| Shoshone | 0.0 /100 | #284 | Tragic 16.2% |
| Immigrants | Bahamas | 0.0 /100 | #285 | Tragic 16.3% |
| Cape Verdeans | 0.0 /100 | #286 | Tragic 16.3% |
| Americans | 0.0 /100 | #287 | Tragic 16.4% |
| Guatemalans | 0.0 /100 | #288 | Tragic 16.4% |
| Osage | 0.0 /100 | #289 | Tragic 16.4% |
| Indonesians | 0.0 /100 | #290 | Tragic 16.4% |
| Comanche | 0.0 /100 | #291 | Tragic 16.5% |
Demographics Similar to Immigrants from Chile by Female Poverty Among 25-34 Year Olds
In terms of female poverty among 25-34 year olds, the demographic groups most similar to Immigrants from Chile are Brazilian (13.1%, a difference of 0.010%), Austrian (13.1%, a difference of 0.14%), Immigrants from England (13.0%, a difference of 0.16%), Immigrants from Iraq (13.1%, a difference of 0.16%), and South African (13.0%, a difference of 0.18%).
| Demographics | Rating | Rank | Female Poverty Among 25-34 Year Olds |
| Immigrants | Uzbekistan | 89.6 /100 | #130 | Excellent 12.9% |
| Pakistanis | 88.4 /100 | #131 | Excellent 13.0% |
| Immigrants | Hungary | 88.3 /100 | #132 | Excellent 13.0% |
| Serbians | 87.6 /100 | #133 | Excellent 13.0% |
| Afghans | 85.8 /100 | #134 | Excellent 13.0% |
| South Africans | 85.7 /100 | #135 | Excellent 13.0% |
| Immigrants | England | 85.5 /100 | #136 | Excellent 13.0% |
| Immigrants | Chile | 84.6 /100 | #137 | Excellent 13.1% |
| Brazilians | 84.5 /100 | #138 | Excellent 13.1% |
| Austrians | 83.7 /100 | #139 | Excellent 13.1% |
| Immigrants | Iraq | 83.6 /100 | #140 | Excellent 13.1% |
| New Zealanders | 83.4 /100 | #141 | Excellent 13.1% |
| Scandinavians | 82.3 /100 | #142 | Excellent 13.1% |
| Israelis | 81.9 /100 | #143 | Excellent 13.1% |
| Native Hawaiians | 78.9 /100 | #144 | Good 13.2% |