Shoshone vs Immigrants from Bosnia and Herzegovina Child Poverty Among Girls Under 16

COMPARE

Shoshone
Race
Ancestry
AfghanAfricanAlaska NativeAlaskan AthabascanAlbanianAleutAlsatianAmericanApacheArabArapahoArgentineanArmenianAssyrian/Chaldean/SyriacAustralianAustrianBahamianBangladeshiBarbadianBasqueBelgianBelizeanBermudanBhutaneseBlackfeetBolivianBrazilianBritishBritish West IndianBulgarianBurmeseCajunCambodianCanadianCape VerdeanCarpatho RusynCelticCentral AmericanCentral American IndianCherokeeCheyenneChickasawChileanChineseChippewaChoctawColombianColvilleComancheCosta RicanCreeCreekCroatianCrowCubanCypriotCzechCzechoslovakianDanishDelawareDominicanDutchDutch West IndianEastern EuropeanEcuadorianEgyptianEnglishEstonianEthiopianEuropeanFijianFilipinoFinnishFrenchFrench American IndianFrench CanadianGermanGerman RussianGhanaianGreekGuamanian/ChamorroGuatemalanGuyaneseHaitianHmongHonduranHopiHoumaHungarianIcelanderIndian (Asian)IndonesianInupiatIranianIraqiIrishIroquoisIsraeliItalianJamaicanJapaneseJordanianKenyanKiowaKoreanLaotianLatvianLebaneseLiberianLithuanianLumbeeLuxembourgerMacedonianMalaysianMalteseMarshalleseMenomineeMexicanMexican American IndianMongolianMoroccanNative HawaiianNavajoNepaleseNew ZealanderNicaraguanNigerianNorthern EuropeanNorwegianOkinawanOsageOttawaPaiutePakistaniPalestinianPanamanianParaguayanPennsylvania GermanPeruvianPimaPolishPortuguesePotawatomiPuebloPuerto RicanPuget Sound SalishRomanianRussianSalvadoranSamoanScandinavianScotch-IrishScottishSeminoleSenegaleseSerbianShoshoneSierra LeoneanSiouxSlavicSlovakSloveneSomaliSouth AfricanSouth AmericanSouth American IndianSoviet UnionSpaniardSpanishSpanish AmericanSpanish American IndianSri LankanSubsaharan AfricanSudaneseSwedishSwissSyrianTaiwaneseThaiTlingit-HaidaTohono O'OdhamTonganTrinidadian and TobagonianTsimshianTurkishU.S. Virgin IslanderUgandanUkrainianUruguayanUteVenezuelanVietnameseWelshWest IndianYakamaYaquiYugoslavianYumanYup'ikZimbabwean
Immigration
NonimmigrantsImmigrantsAfghanistanAfricaAlbaniaArgentinaArmeniaAsiaAustraliaAustriaBahamasBangladeshBarbadosBelarusBelgiumBelizeBoliviaBrazilBulgariaBurma/MyanmarCabo VerdeCambodiaCameroonCanadaCaribbeanCentral AmericaChileChinaColombiaCongoCosta RicaCroatiaCubaCzechoslovakiaDenmarkDominicaDominican RepublicEastern AfricaEastern AsiaEastern EuropeEcuadorEgyptEl SalvadorEnglandEritreaEthiopiaEuropeFijiFranceGermanyGhanaGreeceGrenadaGuatemalaGuyanaHaitiHondurasHong KongHungaryIndiaIndonesiaIranIraqIrelandIsraelItalyJamaicaJapanJordanKazakhstanKenyaKoreaKuwaitLaosLatin AmericaLatviaLebanonLiberiaLithuaniaMalaysiaMexicoMicronesiaMiddle AfricaMoldovaMoroccoNepalNetherlandsNicaraguaNigeriaNorth AmericaNorth MacedoniaNorthern AfricaNorthern EuropeNorwayOceaniaPakistanPanamaPeruPhilippinesPolandPortugalRomaniaRussiaSaudi ArabiaScotlandSenegalSerbiaSierra LeoneSingaporeSomaliaSouth AfricaSouth AmericaSouth Central AsiaSouth Eastern AsiaSouthern EuropeSpainSri LankaSt. Vincent and the GrenadinesSudanSwedenSwitzerlandSyriaTaiwanThailandTrinidad and TobagoTurkeyUgandaUkraineUruguayUzbekistanVenezuelaVietnamWest IndiesWestern AfricaWestern AsiaWestern EuropeYemenZaireZimbabweAzores
Immigrants from Bosnia and Herzegovina
Race
Ancestry
AfghanAfricanAlaska NativeAlaskan AthabascanAlbanianAleutAlsatianAmericanApacheArabArapahoArgentineanArmenianAssyrian/Chaldean/SyriacAustralianAustrianBahamianBangladeshiBarbadianBasqueBelgianBelizeanBermudanBhutaneseBlackfeetBolivianBrazilianBritishBritish West IndianBulgarianBurmeseCajunCambodianCanadianCape VerdeanCarpatho RusynCelticCentral AmericanCentral American IndianCherokeeCheyenneChickasawChileanChineseChippewaChoctawColombianColvilleComancheCosta RicanCreeCreekCroatianCrowCubanCypriotCzechCzechoslovakianDanishDelawareDominicanDutchDutch West IndianEastern EuropeanEcuadorianEgyptianEnglishEstonianEthiopianEuropeanFijianFilipinoFinnishFrenchFrench American IndianFrench CanadianGermanGerman RussianGhanaianGreekGuamanian/ChamorroGuatemalanGuyaneseHaitianHmongHonduranHopiHoumaHungarianIcelanderIndian (Asian)IndonesianInupiatIranianIraqiIrishIroquoisIsraeliItalianJamaicanJapaneseJordanianKenyanKiowaKoreanLaotianLatvianLebaneseLiberianLithuanianLumbeeLuxembourgerMacedonianMalaysianMalteseMarshalleseMenomineeMexicanMexican American IndianMongolianMoroccanNative HawaiianNavajoNepaleseNew ZealanderNicaraguanNigerianNorthern EuropeanNorwegianOkinawanOsageOttawaPaiutePakistaniPalestinianPanamanianParaguayanPennsylvania GermanPeruvianPimaPolishPortuguesePotawatomiPuebloPuerto RicanPuget Sound SalishRomanianRussianSalvadoranSamoanScandinavianScotch-IrishScottishSeminoleSenegaleseSerbianSierra LeoneanSiouxSlavicSlovakSloveneSomaliSouth AfricanSouth AmericanSouth American IndianSoviet UnionSpaniardSpanishSpanish AmericanSpanish American IndianSri LankanSubsaharan AfricanSudaneseSwedishSwissSyrianTaiwaneseThaiTlingit-HaidaTohono O'OdhamTonganTrinidadian and TobagonianTsimshianTurkishU.S. Virgin IslanderUgandanUkrainianUruguayanUteVenezuelanVietnameseWelshWest IndianYakamaYaquiYugoslavianYumanYup'ikZimbabwean
Immigration
NonimmigrantsImmigrantsAfghanistanAfricaAlbaniaArgentinaArmeniaAsiaAustraliaAustriaBahamasBangladeshBarbadosBelarusBelgiumBelizeBoliviaBosnia and HerzegovinaBrazilBulgariaBurma/MyanmarCabo VerdeCambodiaCameroonCanadaCaribbeanCentral AmericaChileChinaColombiaCongoCosta RicaCroatiaCubaCzechoslovakiaDenmarkDominicaDominican RepublicEastern AfricaEastern AsiaEastern EuropeEcuadorEgyptEl SalvadorEnglandEritreaEthiopiaEuropeFijiFranceGermanyGhanaGreeceGrenadaGuatemalaGuyanaHaitiHondurasHong KongHungaryIndiaIndonesiaIranIraqIrelandIsraelItalyJamaicaJapanJordanKazakhstanKenyaKoreaKuwaitLaosLatin AmericaLatviaLebanonLiberiaLithuaniaMalaysiaMexicoMicronesiaMiddle AfricaMoldovaMoroccoNepalNetherlandsNicaraguaNigeriaNorth AmericaNorth MacedoniaNorthern AfricaNorthern EuropeNorwayOceaniaPakistanPanamaPeruPhilippinesPolandPortugalRomaniaRussiaSaudi ArabiaScotlandSenegalSerbiaSierra LeoneSingaporeSomaliaSouth AfricaSouth AmericaSouth Central AsiaSouth Eastern AsiaSouthern EuropeSpainSri LankaSt. Vincent and the GrenadinesSudanSwedenSwitzerlandSyriaTaiwanThailandTrinidad and TobagoTurkeyUgandaUkraineUruguayUzbekistanVenezuelaVietnamWest IndiesWestern AfricaWestern AsiaWestern EuropeYemenZaireZimbabweAzores
Child Poverty Among Girls Under 16
Income
Poverty
Unemployment
Labor Participation
Family Structure
Vehicle Availability
Education Level
Disability

Child Poverty Among Girls Under 16 Comparison

Shoshone

Immigrants from Bosnia and Herzegovina

Tragic
Fair
18.9%
CHILD POVERTY AMONG GIRLS UNDER 16
0.6/ 100
METRIC RATING
245th/ 347
METRIC RANK
16.8%
CHILD POVERTY AMONG GIRLS UNDER 16
32.5/ 100
METRIC RATING
189th/ 347
METRIC RANK

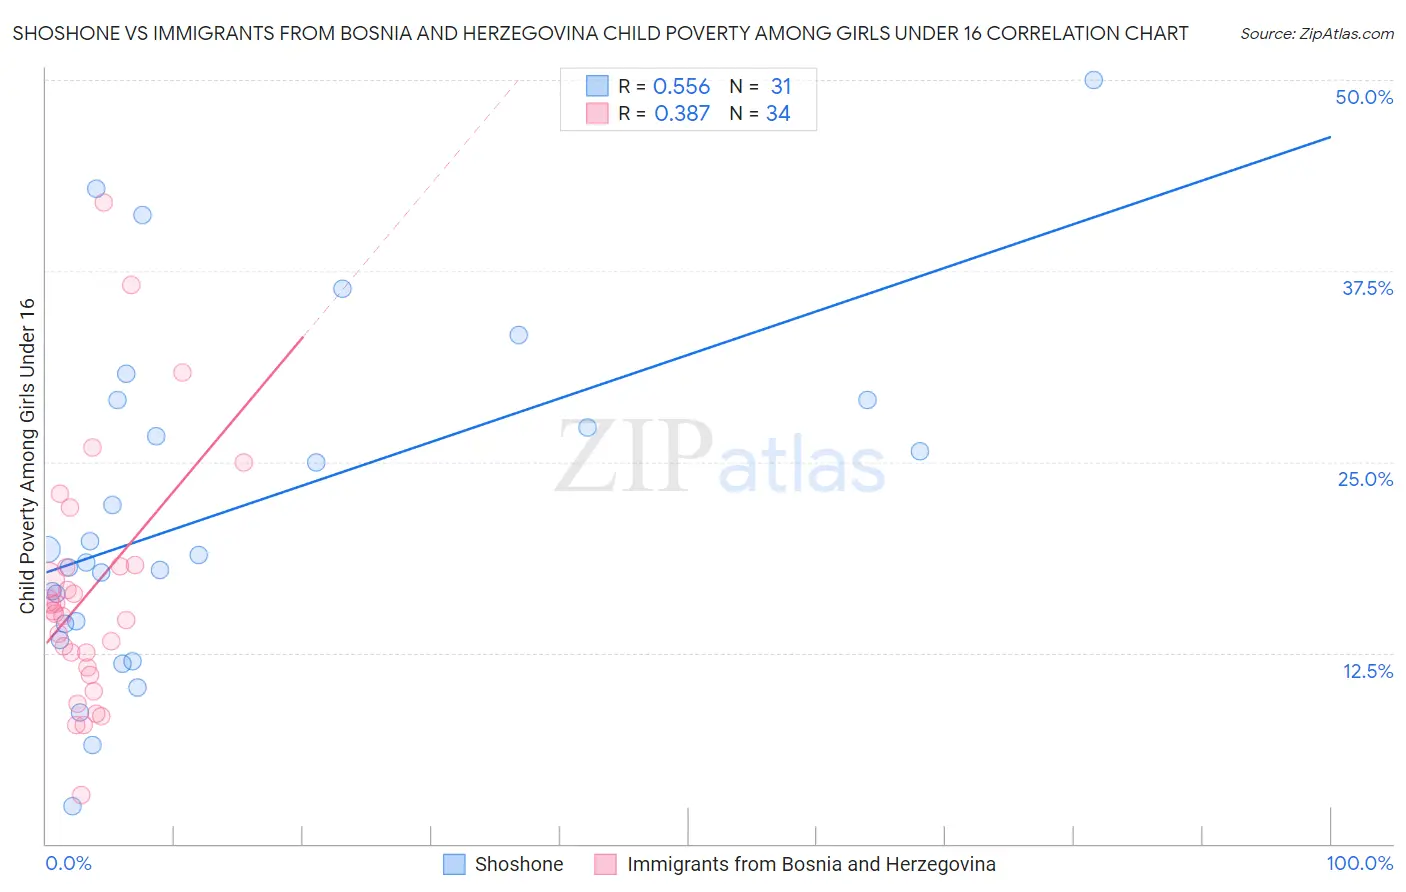
Shoshone vs Immigrants from Bosnia and Herzegovina Child Poverty Among Girls Under 16 Correlation Chart

The statistical analysis conducted on geographies consisting of 66,320,610 people shows a substantial positive correlation between the proportion of Shoshone and poverty level among girls under the age of 16 in the United States with a correlation coefficient (R) of 0.556 and weighted average of 18.9%. Similarly, the statistical analysis conducted on geographies consisting of 155,792,725 people shows a mild positive correlation between the proportion of Immigrants from Bosnia and Herzegovina and poverty level among girls under the age of 16 in the United States with a correlation coefficient (R) of 0.387 and weighted average of 16.8%, a difference of 12.2%.
Shoshone vs Immigrants from Bosnia and Herzegovina Child Poverty Among Girls Under 16

Child Poverty Among Girls Under 16 Correlation Summary

MeasurementShoshoneImmigrants from Bosnia and Herzegovina
Minimum2.5%3.2%
Maximum50.0%42.0%
Range47.5%38.8%
Mean21.8%16.5%
Median18.9%15.1%
Interquartile 25% (IQ1)14.4%11.5%
Interquartile 75% (IQ3)29.0%18.2%
Interquartile Range (IQR)14.6%6.7%
Standard Deviation (Sample)11.0%8.1%
Standard Deviation (Population)10.8%8.0%

Similar Demographics by Child Poverty Among Girls Under 16

Demographics Similar to Shoshone by Child Poverty Among Girls Under 16

In terms of child poverty among girls under 16, the demographic groups most similar to Shoshone are Immigrants from Laos (18.9%, a difference of 0.030%), Ecuadorian (18.8%, a difference of 0.12%), Immigrants from Nicaragua (18.8%, a difference of 0.18%), Immigrants from Ghana (18.9%, a difference of 0.39%), and Immigrants from Cuba (18.8%, a difference of 0.40%).
DemographicsRating | RankChild Poverty Among Girls Under 16
Immigrants | Eritrea
1.0
/100
|
#238
Tragic
18.7%
Marshallese
0.9
/100
|
#239
Tragic
18.7%
Nigerians
0.9
/100
|
#240
Tragic
18.7%
Americans
0.8
/100
|
#241
Tragic
18.8%
Immigrants | Cuba
0.7
/100
|
#242
Tragic
18.8%
Immigrants | Nicaragua
0.7
/100
|
#243
Tragic
18.8%
Ecuadorians
0.7
/100
|
#244
Tragic
18.8%
Shoshone
0.6
/100
|
#245
Tragic
18.9%
Immigrants | Laos
0.6
/100
|
#246
Tragic
18.9%
Immigrants | Ghana
0.5
/100
|
#247
Tragic
18.9%
French American Indians
0.3
/100
|
#248
Tragic
19.2%
Potawatomi
0.3
/100
|
#249
Tragic
19.2%
Cape Verdeans
0.3
/100
|
#250
Tragic
19.2%
Immigrants | Trinidad and Tobago
0.3
/100
|
#251
Tragic
19.2%
Immigrants | Middle Africa
0.3
/100
|
#252
Tragic
19.2%

Demographics Similar to Immigrants from Bosnia and Herzegovina by Child Poverty Among Girls Under 16

In terms of child poverty among girls under 16, the demographic groups most similar to Immigrants from Bosnia and Herzegovina are Kenyan (16.8%, a difference of 0.040%), Immigrants from the Azores (16.8%, a difference of 0.16%), Immigrants from Uganda (16.8%, a difference of 0.17%), Arab (16.8%, a difference of 0.25%), and Immigrants from Morocco (16.8%, a difference of 0.26%).
DemographicsRating | RankChild Poverty Among Girls Under 16
Immigrants | Ethiopia
43.1
/100
|
#182
Average
16.6%
Immigrants | Portugal
42.5
/100
|
#183
Average
16.6%
Scotch-Irish
39.6
/100
|
#184
Fair
16.7%
Immigrants | Uruguay
35.6
/100
|
#185
Fair
16.7%
South American Indians
35.0
/100
|
#186
Fair
16.8%
Immigrants | Morocco
34.6
/100
|
#187
Fair
16.8%
Arabs
34.5
/100
|
#188
Fair
16.8%
Immigrants | Bosnia and Herzegovina
32.5
/100
|
#189
Fair
16.8%
Kenyans
32.3
/100
|
#190
Fair
16.8%
Immigrants | Azores
31.3
/100
|
#191
Fair
16.8%
Immigrants | Uganda
31.3
/100
|
#192
Fair
16.8%
Aleuts
28.7
/100
|
#193
Fair
16.9%
Spanish
28.6
/100
|
#194
Fair
16.9%
Immigrants | Costa Rica
25.6
/100
|
#195
Fair
17.0%
Celtics
25.2
/100
|
#196
Fair
17.0%