Senegalese vs West Indian Seniors Poverty Over the Age of 75
COMPARE
Senegalese
West Indian
Seniors Poverty Over the Age of 75
Seniors Poverty Over the Age of 75 Comparison
Senegalese
West Indians
14.5%
SENIORS POVERTY OVER THE AGE OF 75
0.0/ 100
METRIC RATING
277th/ 347
METRIC RANK
15.7%
SENIORS POVERTY OVER THE AGE OF 75
0.0/ 100
METRIC RATING
302nd/ 347
METRIC RANK
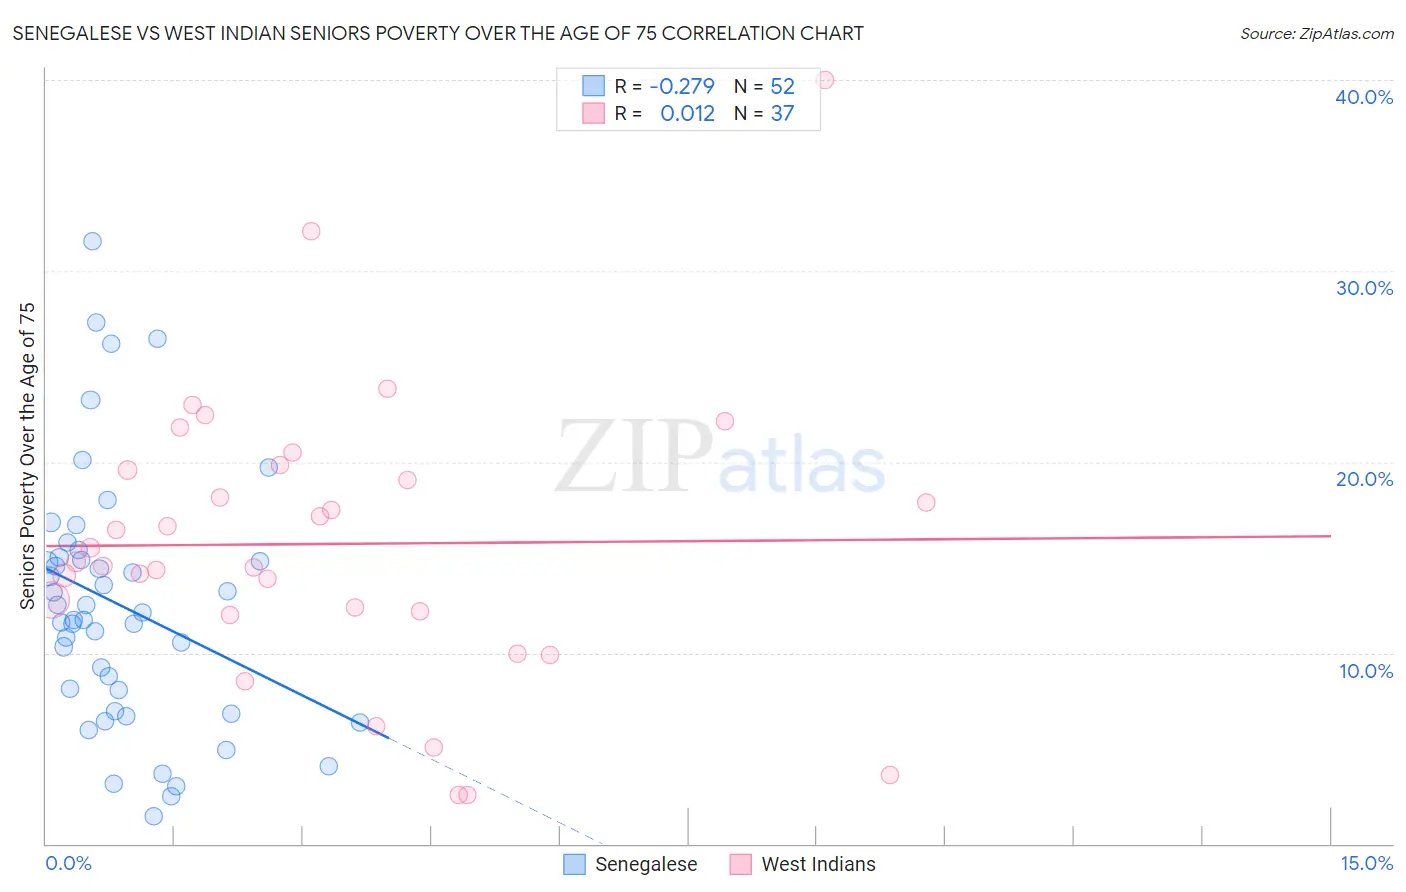
Senegalese vs West Indian Seniors Poverty Over the Age of 75 Correlation Chart
The statistical analysis conducted on geographies consisting of 77,878,281 people shows a weak negative correlation between the proportion of Senegalese and poverty level among seniors over the age of 75 in the United States with a correlation coefficient (R) of -0.279 and weighted average of 14.5%. Similarly, the statistical analysis conducted on geographies consisting of 252,374,220 people shows no correlation between the proportion of West Indians and poverty level among seniors over the age of 75 in the United States with a correlation coefficient (R) of 0.012 and weighted average of 15.7%, a difference of 8.1%.
Seniors Poverty Over the Age of 75 Correlation Summary
| Measurement | Senegalese | West Indian |
| Minimum | 1.5% | 2.6% |
| Maximum | 31.6% | 40.0% |
| Range | 30.1% | 37.4% |
| Mean | 12.5% | 15.7% |
| Median | 11.9% | 14.8% |
| Interquartile 25% (IQ1) | 7.5% | 12.1% |
| Interquartile 75% (IQ3) | 14.9% | 19.7% |
| Interquartile Range (IQR) | 7.5% | 7.6% |
| Standard Deviation (Sample) | 6.6% | 7.6% |
| Standard Deviation (Population) | 6.5% | 7.5% |
Similar Demographics by Seniors Poverty Over the Age of 75
Demographics Similar to Senegalese by Seniors Poverty Over the Age of 75
In terms of seniors poverty over the age of 75, the demographic groups most similar to Senegalese are Soviet Union (14.5%, a difference of 0.27%), Immigrants from El Salvador (14.5%, a difference of 0.32%), Immigrants from Bahamas (14.4%, a difference of 0.49%), Immigrants from South America (14.4%, a difference of 0.65%), and Immigrants from Colombia (14.6%, a difference of 0.77%).
| Demographics | Rating | Rank | Seniors Poverty Over the Age of 75 |
| Immigrants | Uruguay | 0.0 /100 | #270 | Tragic 14.3% |
| Immigrants | Ghana | 0.0 /100 | #271 | Tragic 14.4% |
| Mexicans | 0.0 /100 | #272 | Tragic 14.4% |
| Immigrants | South America | 0.0 /100 | #273 | Tragic 14.4% |
| Immigrants | Bahamas | 0.0 /100 | #274 | Tragic 14.4% |
| Immigrants | El Salvador | 0.0 /100 | #275 | Tragic 14.5% |
| Soviet Union | 0.0 /100 | #276 | Tragic 14.5% |
| Senegalese | 0.0 /100 | #277 | Tragic 14.5% |
| Immigrants | Colombia | 0.0 /100 | #278 | Tragic 14.6% |
| Blacks/African Americans | 0.0 /100 | #279 | Tragic 14.6% |
| Central Americans | 0.0 /100 | #280 | Tragic 14.7% |
| Belizeans | 0.0 /100 | #281 | Tragic 14.8% |
| Immigrants | Senegal | 0.0 /100 | #282 | Tragic 14.8% |
| Guatemalans | 0.0 /100 | #283 | Tragic 14.8% |
| Cheyenne | 0.0 /100 | #284 | Tragic 14.9% |
Demographics Similar to West Indians by Seniors Poverty Over the Age of 75
In terms of seniors poverty over the age of 75, the demographic groups most similar to West Indians are Immigrants from Honduras (15.7%, a difference of 0.17%), Immigrants from Latin America (15.6%, a difference of 0.31%), Immigrants from Trinidad and Tobago (15.7%, a difference of 0.35%), Ecuadorian (15.7%, a difference of 0.39%), and Hispanic or Latino (15.8%, a difference of 0.55%).
| Demographics | Rating | Rank | Seniors Poverty Over the Age of 75 |
| U.S. Virgin Islanders | 0.0 /100 | #295 | Tragic 15.4% |
| Yuman | 0.0 /100 | #296 | Tragic 15.4% |
| Hondurans | 0.0 /100 | #297 | Tragic 15.4% |
| Natives/Alaskans | 0.0 /100 | #298 | Tragic 15.5% |
| Spanish American Indians | 0.0 /100 | #299 | Tragic 15.5% |
| Bahamians | 0.0 /100 | #300 | Tragic 15.5% |
| Immigrants | Latin America | 0.0 /100 | #301 | Tragic 15.6% |
| West Indians | 0.0 /100 | #302 | Tragic 15.7% |
| Immigrants | Honduras | 0.0 /100 | #303 | Tragic 15.7% |
| Immigrants | Trinidad and Tobago | 0.0 /100 | #304 | Tragic 15.7% |
| Ecuadorians | 0.0 /100 | #305 | Tragic 15.7% |
| Hispanics or Latinos | 0.0 /100 | #306 | Tragic 15.8% |
| Immigrants | West Indies | 0.0 /100 | #307 | Tragic 15.8% |
| Immigrants | Bangladesh | 0.0 /100 | #308 | Tragic 15.8% |
| Yup'ik | 0.0 /100 | #309 | Tragic 15.8% |