German vs West Indian Seniors Poverty Over the Age of 75

COMPARE

German
Race
Ancestry
AfghanAfricanAlaska NativeAlaskan AthabascanAlbanianAleutAlsatianAmericanApacheArabArapahoArgentineanArmenianAssyrian/Chaldean/SyriacAustralianAustrianBahamianBangladeshiBarbadianBasqueBelgianBelizeanBermudanBhutaneseBlackfeetBolivianBrazilianBritishBritish West IndianBulgarianBurmeseCajunCambodianCanadianCape VerdeanCarpatho RusynCelticCentral AmericanCentral American IndianCherokeeCheyenneChickasawChileanChineseChippewaChoctawColombianColvilleComancheCosta RicanCreeCreekCroatianCrowCubanCypriotCzechCzechoslovakianDanishDelawareDominicanDutchDutch West IndianEastern EuropeanEcuadorianEgyptianEnglishEstonianEthiopianEuropeanFijianFilipinoFinnishFrenchFrench American IndianFrench CanadianGermanGerman RussianGhanaianGreekGuamanian/ChamorroGuatemalanGuyaneseHaitianHmongHonduranHopiHoumaHungarianIcelanderIndian (Asian)IndonesianInupiatIranianIraqiIrishIroquoisIsraeliItalianJamaicanJapaneseJordanianKenyanKiowaKoreanLaotianLatvianLebaneseLiberianLithuanianLumbeeLuxembourgerMacedonianMalaysianMalteseMarshalleseMenomineeMexicanMexican American IndianMongolianMoroccanNative HawaiianNavajoNepaleseNew ZealanderNicaraguanNigerianNorthern EuropeanNorwegianOkinawanOsageOttawaPaiutePakistaniPalestinianPanamanianParaguayanPennsylvania GermanPeruvianPimaPolishPortuguesePotawatomiPuebloPuerto RicanPuget Sound SalishRomanianRussianSalvadoranSamoanScandinavianScotch-IrishScottishSeminoleSenegaleseSerbianShoshoneSierra LeoneanSiouxSlavicSlovakSloveneSomaliSouth AfricanSouth AmericanSouth American IndianSoviet UnionSpaniardSpanishSpanish AmericanSpanish American IndianSri LankanSubsaharan AfricanSudaneseSwedishSwissSyrianTaiwaneseThaiTlingit-HaidaTohono O'OdhamTonganTrinidadian and TobagonianTsimshianTurkishU.S. Virgin IslanderUgandanUkrainianUruguayanUteVenezuelanVietnameseWelshYakamaYaquiYugoslavianYumanYup'ikZimbabwean
Immigration
NonimmigrantsImmigrantsAfghanistanAfricaAlbaniaArgentinaArmeniaAsiaAustraliaAustriaBahamasBangladeshBarbadosBelarusBelgiumBelizeBoliviaBosnia and HerzegovinaBrazilBulgariaBurma/MyanmarCabo VerdeCambodiaCameroonCanadaCaribbeanCentral AmericaChileChinaColombiaCongoCosta RicaCroatiaCubaCzechoslovakiaDenmarkDominicaDominican RepublicEastern AfricaEastern AsiaEastern EuropeEcuadorEgyptEl SalvadorEnglandEritreaEthiopiaEuropeFijiFranceGermanyGhanaGreeceGrenadaGuatemalaGuyanaHaitiHondurasHong KongHungaryIndiaIndonesiaIranIraqIrelandIsraelItalyJamaicaJapanJordanKazakhstanKenyaKoreaKuwaitLaosLatin AmericaLatviaLebanonLiberiaLithuaniaMalaysiaMexicoMicronesiaMiddle AfricaMoldovaMoroccoNepalNetherlandsNicaraguaNigeriaNorth AmericaNorth MacedoniaNorthern AfricaNorthern EuropeNorwayOceaniaPakistanPanamaPeruPhilippinesPolandPortugalRomaniaRussiaSaudi ArabiaScotlandSenegalSerbiaSierra LeoneSingaporeSomaliaSouth AfricaSouth AmericaSouth Central AsiaSouth Eastern AsiaSouthern EuropeSpainSri LankaSt. Vincent and the GrenadinesSudanSwedenSwitzerlandSyriaTaiwanThailandTrinidad and TobagoTurkeyUgandaUkraineUruguayUzbekistanVenezuelaVietnamWest IndiesWestern AfricaWestern AsiaWestern EuropeYemenZaireZimbabweAzores
West Indian
Race
Ancestry
AfghanAfricanAlaska NativeAlaskan AthabascanAlbanianAleutAlsatianAmericanApacheArabArapahoArgentineanArmenianAssyrian/Chaldean/SyriacAustralianAustrianBahamianBangladeshiBarbadianBasqueBelgianBelizeanBermudanBhutaneseBlackfeetBolivianBrazilianBritishBritish West IndianBulgarianBurmeseCajunCambodianCanadianCape VerdeanCarpatho RusynCelticCentral AmericanCentral American IndianCherokeeCheyenneChickasawChileanChineseChippewaChoctawColombianColvilleComancheCosta RicanCreeCreekCroatianCrowCubanCypriotCzechCzechoslovakianDanishDelawareDominicanDutchDutch West IndianEastern EuropeanEcuadorianEgyptianEnglishEstonianEthiopianEuropeanFijianFilipinoFinnishFrenchFrench American IndianFrench CanadianGerman RussianGhanaianGreekGuamanian/ChamorroGuatemalanGuyaneseHaitianHmongHonduranHopiHoumaHungarianIcelanderIndian (Asian)IndonesianInupiatIranianIraqiIrishIroquoisIsraeliItalianJamaicanJapaneseJordanianKenyanKiowaKoreanLaotianLatvianLebaneseLiberianLithuanianLumbeeLuxembourgerMacedonianMalaysianMalteseMarshalleseMenomineeMexicanMexican American IndianMongolianMoroccanNative HawaiianNavajoNepaleseNew ZealanderNicaraguanNigerianNorthern EuropeanNorwegianOkinawanOsageOttawaPaiutePakistaniPalestinianPanamanianParaguayanPennsylvania GermanPeruvianPimaPolishPortuguesePotawatomiPuebloPuerto RicanPuget Sound SalishRomanianRussianSalvadoranSamoanScandinavianScotch-IrishScottishSeminoleSenegaleseSerbianShoshoneSierra LeoneanSiouxSlavicSlovakSloveneSomaliSouth AfricanSouth AmericanSouth American IndianSoviet UnionSpaniardSpanishSpanish AmericanSpanish American IndianSri LankanSubsaharan AfricanSudaneseSwedishSwissSyrianTaiwaneseThaiTlingit-HaidaTohono O'OdhamTonganTrinidadian and TobagonianTsimshianTurkishU.S. Virgin IslanderUgandanUkrainianUruguayanUteVenezuelanVietnameseWelshWest IndianYakamaYaquiYugoslavianYumanYup'ikZimbabwean
Immigration
NonimmigrantsImmigrantsAfghanistanAfricaAlbaniaArgentinaArmeniaAsiaAustraliaAustriaBahamasBangladeshBarbadosBelarusBelgiumBelizeBoliviaBosnia and HerzegovinaBrazilBulgariaBurma/MyanmarCabo VerdeCambodiaCameroonCanadaCaribbeanCentral AmericaChileChinaColombiaCongoCosta RicaCroatiaCubaCzechoslovakiaDenmarkDominicaDominican RepublicEastern AfricaEastern AsiaEastern EuropeEcuadorEgyptEl SalvadorEnglandEritreaEthiopiaEuropeFijiFranceGermanyGhanaGreeceGrenadaGuatemalaGuyanaHaitiHondurasHong KongHungaryIndiaIndonesiaIranIraqIrelandIsraelItalyJamaicaJapanJordanKazakhstanKenyaKoreaKuwaitLaosLatin AmericaLatviaLebanonLiberiaLithuaniaMalaysiaMexicoMicronesiaMiddle AfricaMoldovaMoroccoNepalNetherlandsNicaraguaNigeriaNorth AmericaNorth MacedoniaNorthern AfricaNorthern EuropeNorwayOceaniaPakistanPanamaPeruPhilippinesPolandPortugalRomaniaRussiaSaudi ArabiaScotlandSenegalSerbiaSierra LeoneSingaporeSomaliaSouth AfricaSouth AmericaSouth Central AsiaSouth Eastern AsiaSouthern EuropeSpainSri LankaSt. Vincent and the GrenadinesSudanSwedenSwitzerlandSyriaTaiwanThailandTrinidad and TobagoTurkeyUgandaUkraineUruguayUzbekistanVenezuelaVietnamWest IndiesWestern AfricaWestern AsiaWestern EuropeYemenZaireZimbabweAzores
Seniors Poverty Over the Age of 75
Income
Poverty
Unemployment
Labor Participation
Family Structure
Vehicle Availability
Education Level
Disability

Seniors Poverty Over the Age of 75 Comparison

Germans

West Indians

Exceptional
Tragic
10.4%
SENIORS POVERTY OVER THE AGE OF 75
99.9/ 100
METRIC RATING
8th/ 347
METRIC RANK
15.7%
SENIORS POVERTY OVER THE AGE OF 75
0.0/ 100
METRIC RATING
302nd/ 347
METRIC RANK

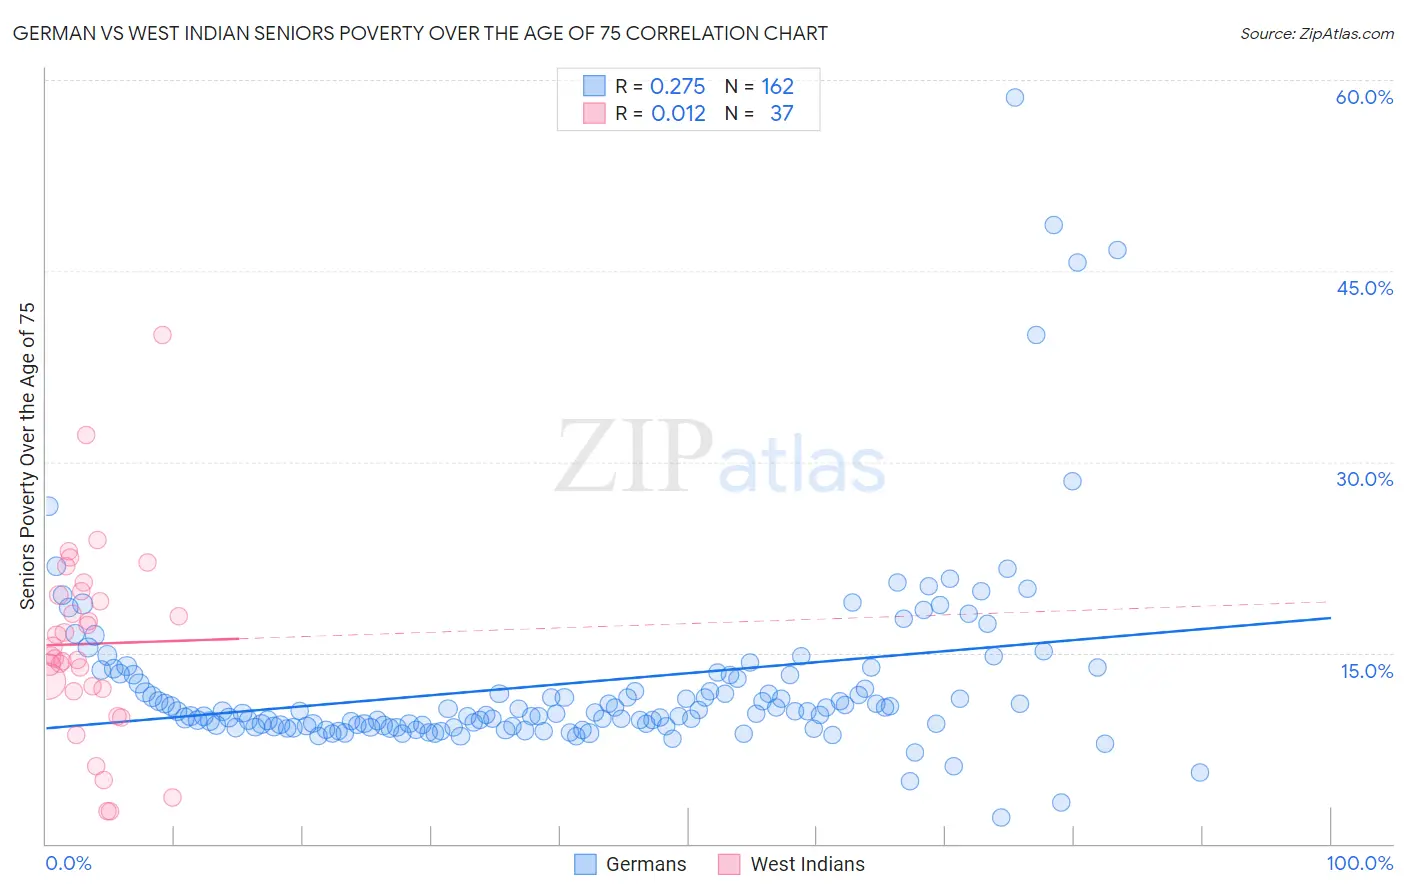
German vs West Indian Seniors Poverty Over the Age of 75 Correlation Chart

The statistical analysis conducted on geographies consisting of 561,355,841 people shows a weak positive correlation between the proportion of Germans and poverty level among seniors over the age of 75 in the United States with a correlation coefficient (R) of 0.275 and weighted average of 10.4%. Similarly, the statistical analysis conducted on geographies consisting of 252,374,220 people shows no correlation between the proportion of West Indians and poverty level among seniors over the age of 75 in the United States with a correlation coefficient (R) of 0.012 and weighted average of 15.7%, a difference of 51.5%.
German vs West Indian Seniors Poverty Over the Age of 75

Seniors Poverty Over the Age of 75 Correlation Summary

MeasurementGermanWest Indian
Minimum2.0%2.6%
Maximum58.6%40.0%
Range56.6%37.4%
Mean12.6%15.7%
Median10.4%14.8%
Interquartile 25% (IQ1)9.3%12.1%
Interquartile 75% (IQ3)13.2%19.7%
Interquartile Range (IQR)4.0%7.6%
Standard Deviation (Sample)7.5%7.6%
Standard Deviation (Population)7.5%7.5%

Similar Demographics by Seniors Poverty Over the Age of 75

Demographics Similar to Germans by Seniors Poverty Over the Age of 75

In terms of seniors poverty over the age of 75, the demographic groups most similar to Germans are English (10.4%, a difference of 0.34%), Maltese (10.3%, a difference of 0.58%), Scandinavian (10.4%, a difference of 0.84%), Immigrants from India (10.4%, a difference of 0.91%), and Danish (10.2%, a difference of 1.2%).
DemographicsRating | RankSeniors Poverty Over the Age of 75
Chinese
100.0
/100
|
#1
Exceptional
9.1%
Tlingit-Haida
100.0
/100
|
#2
Exceptional
9.7%
Native Hawaiians
100.0
/100
|
#3
Exceptional
10.1%
Swedes
100.0
/100
|
#4
Exceptional
10.2%
Norwegians
100.0
/100
|
#5
Exceptional
10.2%
Danes
100.0
/100
|
#6
Exceptional
10.2%
Maltese
100.0
/100
|
#7
Exceptional
10.3%
Germans
99.9
/100
|
#8
Exceptional
10.4%
English
99.9
/100
|
#9
Exceptional
10.4%
Scandinavians
99.9
/100
|
#10
Exceptional
10.4%
Immigrants | India
99.9
/100
|
#11
Exceptional
10.4%
Tongans
99.9
/100
|
#12
Exceptional
10.5%
Croatians
99.9
/100
|
#13
Exceptional
10.5%
Scottish
99.9
/100
|
#14
Exceptional
10.5%
Europeans
99.9
/100
|
#15
Exceptional
10.5%

Demographics Similar to West Indians by Seniors Poverty Over the Age of 75

In terms of seniors poverty over the age of 75, the demographic groups most similar to West Indians are Immigrants from Honduras (15.7%, a difference of 0.17%), Immigrants from Latin America (15.6%, a difference of 0.31%), Immigrants from Trinidad and Tobago (15.7%, a difference of 0.35%), Ecuadorian (15.7%, a difference of 0.39%), and Hispanic or Latino (15.8%, a difference of 0.55%).
DemographicsRating | RankSeniors Poverty Over the Age of 75
U.S. Virgin Islanders
0.0
/100
|
#295
Tragic
15.4%
Yuman
0.0
/100
|
#296
Tragic
15.4%
Hondurans
0.0
/100
|
#297
Tragic
15.4%
Natives/Alaskans
0.0
/100
|
#298
Tragic
15.5%
Spanish American Indians
0.0
/100
|
#299
Tragic
15.5%
Bahamians
0.0
/100
|
#300
Tragic
15.5%
Immigrants | Latin America
0.0
/100
|
#301
Tragic
15.6%
West Indians
0.0
/100
|
#302
Tragic
15.7%
Immigrants | Honduras
0.0
/100
|
#303
Tragic
15.7%
Immigrants | Trinidad and Tobago
0.0
/100
|
#304
Tragic
15.7%
Ecuadorians
0.0
/100
|
#305
Tragic
15.7%
Hispanics or Latinos
0.0
/100
|
#306
Tragic
15.8%
Immigrants | West Indies
0.0
/100
|
#307
Tragic
15.8%
Immigrants | Bangladesh
0.0
/100
|
#308
Tragic
15.8%
Yup'ik
0.0
/100
|
#309
Tragic
15.8%