Senegalese vs Lebanese Single Male Poverty
COMPARE
Senegalese
Lebanese
Single Male Poverty
Single Male Poverty Comparison
Senegalese
Lebanese
13.1%
SINGLE MALE POVERTY
16.4/ 100
METRIC RATING
212th/ 347
METRIC RANK
13.2%
SINGLE MALE POVERTY
6.6/ 100
METRIC RATING
228th/ 347
METRIC RANK
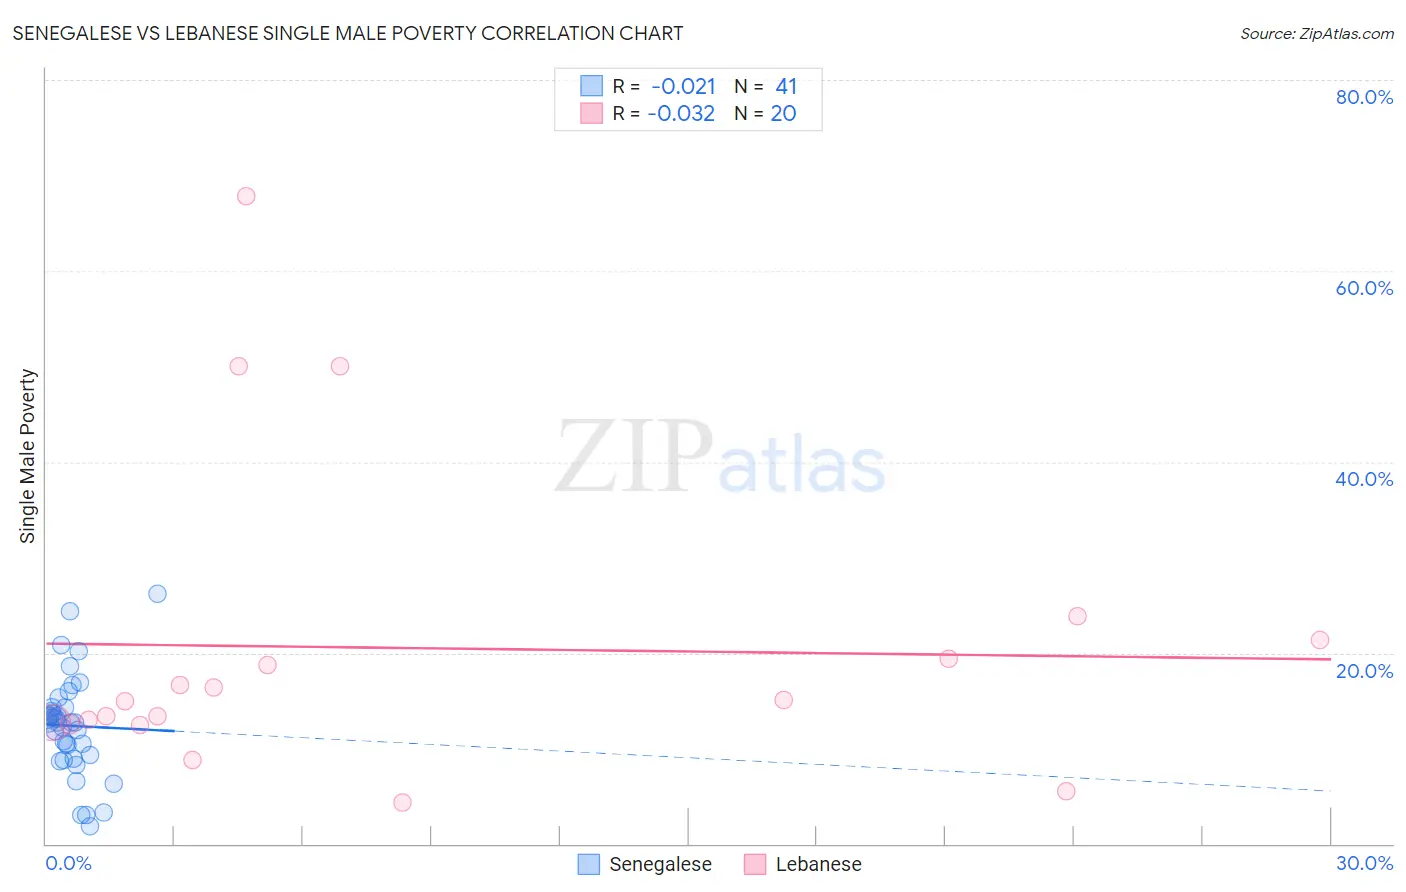
Senegalese vs Lebanese Single Male Poverty Correlation Chart
The statistical analysis conducted on geographies consisting of 76,027,863 people shows no correlation between the proportion of Senegalese and poverty level among single males in the United States with a correlation coefficient (R) of -0.021 and weighted average of 13.1%. Similarly, the statistical analysis conducted on geographies consisting of 352,480,661 people shows no correlation between the proportion of Lebanese and poverty level among single males in the United States with a correlation coefficient (R) of -0.032 and weighted average of 13.2%, a difference of 1.3%.
Single Male Poverty Correlation Summary
| Measurement | Senegalese | Lebanese |
| Minimum | 1.8% | 4.3% |
| Maximum | 26.2% | 67.9% |
| Range | 24.4% | 63.6% |
| Mean | 12.4% | 20.5% |
| Median | 12.7% | 15.0% |
| Interquartile 25% (IQ1) | 9.1% | 12.6% |
| Interquartile 75% (IQ3) | 14.3% | 20.4% |
| Interquartile Range (IQR) | 5.2% | 7.8% |
| Standard Deviation (Sample) | 5.2% | 16.3% |
| Standard Deviation (Population) | 5.2% | 15.9% |
Demographics Similar to Senegalese and Lebanese by Single Male Poverty
In terms of single male poverty, the demographic groups most similar to Senegalese are Swedish (13.1%, a difference of 0.030%), Immigrants from Haiti (13.1%, a difference of 0.040%), Italian (13.1%, a difference of 0.050%), Zimbabwean (13.1%, a difference of 0.15%), and Japanese (13.1%, a difference of 0.16%). Similarly, the demographic groups most similar to Lebanese are Haitian (13.2%, a difference of 0.080%), European (13.3%, a difference of 0.090%), Ghanaian (13.3%, a difference of 0.12%), Jamaican (13.2%, a difference of 0.21%), and Immigrants from Denmark (13.2%, a difference of 0.37%).
| Demographics | Rating | Rank | Single Male Poverty |
| Immigrants | Haiti | 16.8 /100 | #210 | Poor 13.1% |
| Swedes | 16.8 /100 | #211 | Poor 13.1% |
| Senegalese | 16.4 /100 | #212 | Poor 13.1% |
| Italians | 15.9 /100 | #213 | Poor 13.1% |
| Zimbabweans | 14.9 /100 | #214 | Poor 13.1% |
| Japanese | 14.8 /100 | #215 | Poor 13.1% |
| Austrians | 13.9 /100 | #216 | Poor 13.1% |
| Bermudans | 13.0 /100 | #217 | Poor 13.1% |
| Scandinavians | 12.9 /100 | #218 | Poor 13.1% |
| Immigrants | Burma/Myanmar | 12.6 /100 | #219 | Poor 13.1% |
| Central Americans | 10.9 /100 | #220 | Poor 13.2% |
| New Zealanders | 10.7 /100 | #221 | Poor 13.2% |
| Immigrants | Western Europe | 10.0 /100 | #222 | Poor 13.2% |
| Immigrants | Azores | 9.3 /100 | #223 | Tragic 13.2% |
| Somalis | 9.1 /100 | #224 | Tragic 13.2% |
| Immigrants | Denmark | 8.7 /100 | #225 | Tragic 13.2% |
| Jamaicans | 7.7 /100 | #226 | Tragic 13.2% |
| Haitians | 7.0 /100 | #227 | Tragic 13.2% |
| Lebanese | 6.6 /100 | #228 | Tragic 13.2% |
| Europeans | 6.2 /100 | #229 | Tragic 13.3% |
| Ghanaians | 6.1 /100 | #230 | Tragic 13.3% |