Scottish vs Sudanese Family Poverty
COMPARE
Scottish
Sudanese
Family Poverty
Family Poverty Comparison
Scottish
Sudanese
7.9%
FAMILY POVERTY
97.3/ 100
METRIC RATING
86th/ 347
METRIC RANK
10.0%
FAMILY POVERTY
3.1/ 100
METRIC RATING
228th/ 347
METRIC RANK
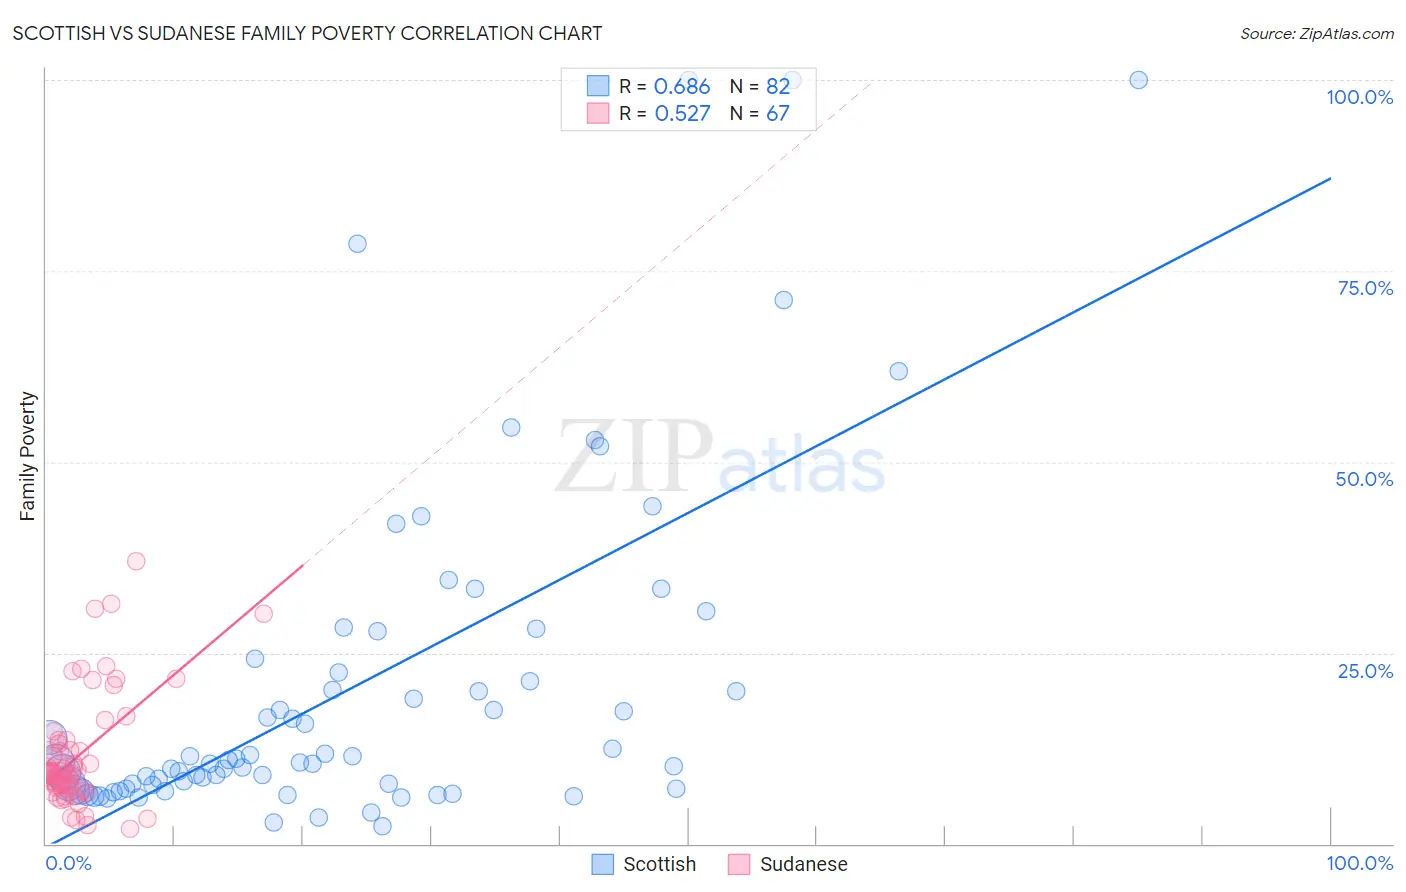
Scottish vs Sudanese Family Poverty Correlation Chart
The statistical analysis conducted on geographies consisting of 562,331,846 people shows a significant positive correlation between the proportion of Scottish and poverty level among families in the United States with a correlation coefficient (R) of 0.686 and weighted average of 7.9%. Similarly, the statistical analysis conducted on geographies consisting of 110,085,531 people shows a substantial positive correlation between the proportion of Sudanese and poverty level among families in the United States with a correlation coefficient (R) of 0.527 and weighted average of 10.0%, a difference of 26.1%.
Family Poverty Correlation Summary
| Measurement | Scottish | Sudanese |
| Minimum | 2.3% | 1.9% |
| Maximum | 100.0% | 36.9% |
| Range | 97.7% | 35.0% |
| Mean | 20.4% | 11.5% |
| Median | 10.7% | 9.2% |
| Interquartile 25% (IQ1) | 7.2% | 7.3% |
| Interquartile 75% (IQ3) | 22.4% | 13.1% |
| Interquartile Range (IQR) | 15.2% | 5.8% |
| Standard Deviation (Sample) | 22.2% | 7.3% |
| Standard Deviation (Population) | 22.1% | 7.3% |
Similar Demographics by Family Poverty
Demographics Similar to Scottish by Family Poverty
In terms of family poverty, the demographic groups most similar to Scottish are Immigrants from Asia (7.9%, a difference of 0.040%), Belgian (8.0%, a difference of 0.090%), Serbian (8.0%, a difference of 0.15%), British (7.9%, a difference of 0.29%), and Immigrants from Denmark (8.0%, a difference of 0.30%).
| Demographics | Rating | Rank | Family Poverty |
| Immigrants | Europe | 97.8 /100 | #79 | Exceptional 7.9% |
| English | 97.8 /100 | #80 | Exceptional 7.9% |
| Irish | 97.8 /100 | #81 | Exceptional 7.9% |
| Immigrants | Poland | 97.8 /100 | #82 | Exceptional 7.9% |
| Slovaks | 97.7 /100 | #83 | Exceptional 7.9% |
| British | 97.5 /100 | #84 | Exceptional 7.9% |
| Immigrants | Asia | 97.4 /100 | #85 | Exceptional 7.9% |
| Scottish | 97.3 /100 | #86 | Exceptional 7.9% |
| Belgians | 97.3 /100 | #87 | Exceptional 8.0% |
| Serbians | 97.2 /100 | #88 | Exceptional 8.0% |
| Immigrants | Denmark | 97.1 /100 | #89 | Exceptional 8.0% |
| Immigrants | England | 97.1 /100 | #90 | Exceptional 8.0% |
| Immigrants | Italy | 97.0 /100 | #91 | Exceptional 8.0% |
| Czechoslovakians | 96.8 /100 | #92 | Exceptional 8.0% |
| Tlingit-Haida | 96.7 /100 | #93 | Exceptional 8.0% |
Demographics Similar to Sudanese by Family Poverty
In terms of family poverty, the demographic groups most similar to Sudanese are Immigrants from Uzbekistan (10.0%, a difference of 0.010%), Immigrants from Panama (10.0%, a difference of 0.030%), Immigrants from Armenia (10.0%, a difference of 0.20%), Ottawa (10.0%, a difference of 0.22%), and Alaskan Athabascan (10.1%, a difference of 0.41%).
| Demographics | Rating | Rank | Family Poverty |
| Immigrants | Cambodia | 4.8 /100 | #221 | Tragic 9.9% |
| Japanese | 4.8 /100 | #222 | Tragic 9.9% |
| Immigrants | Africa | 4.3 /100 | #223 | Tragic 9.9% |
| Marshallese | 3.9 /100 | #224 | Tragic 9.9% |
| Immigrants | Immigrants | 3.6 /100 | #225 | Tragic 10.0% |
| Ottawa | 3.3 /100 | #226 | Tragic 10.0% |
| Immigrants | Armenia | 3.3 /100 | #227 | Tragic 10.0% |
| Sudanese | 3.1 /100 | #228 | Tragic 10.0% |
| Immigrants | Uzbekistan | 3.1 /100 | #229 | Tragic 10.0% |
| Immigrants | Panama | 3.1 /100 | #230 | Tragic 10.0% |
| Alaskan Athabascans | 2.7 /100 | #231 | Tragic 10.1% |
| Immigrants | Sudan | 2.3 /100 | #232 | Tragic 10.1% |
| Fijians | 2.1 /100 | #233 | Tragic 10.1% |
| Immigrants | Middle Africa | 2.1 /100 | #234 | Tragic 10.1% |
| Nigerians | 2.0 /100 | #235 | Tragic 10.1% |