Samoan vs Immigrants from Jordan Single Male Poverty
COMPARE
Samoan
Immigrants from Jordan
Single Male Poverty
Single Male Poverty Comparison
Samoans
Immigrants from Jordan
11.7%
SINGLE MALE POVERTY
99.9/ 100
METRIC RATING
52nd/ 347
METRIC RANK
12.5%
SINGLE MALE POVERTY
87.1/ 100
METRIC RATING
125th/ 347
METRIC RANK
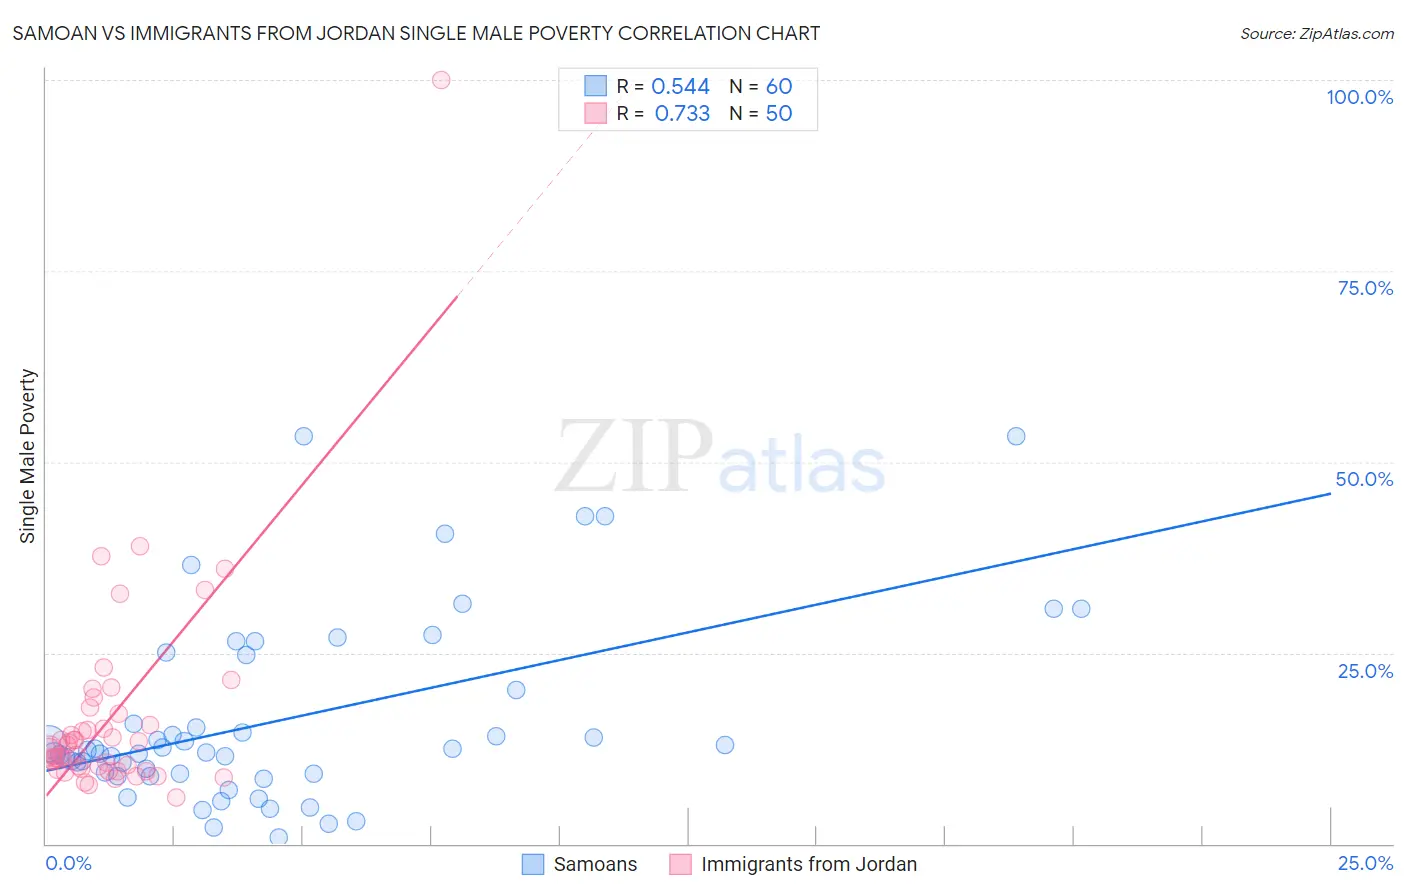
Samoan vs Immigrants from Jordan Single Male Poverty Correlation Chart
The statistical analysis conducted on geographies consisting of 211,659,255 people shows a substantial positive correlation between the proportion of Samoans and poverty level among single males in the United States with a correlation coefficient (R) of 0.544 and weighted average of 11.7%. Similarly, the statistical analysis conducted on geographies consisting of 169,036,341 people shows a strong positive correlation between the proportion of Immigrants from Jordan and poverty level among single males in the United States with a correlation coefficient (R) of 0.733 and weighted average of 12.5%, a difference of 7.1%.
Single Male Poverty Correlation Summary
| Measurement | Samoan | Immigrants from Jordan |
| Minimum | 0.75% | 6.0% |
| Maximum | 53.3% | 100.0% |
| Range | 52.6% | 94.0% |
| Mean | 16.3% | 16.7% |
| Median | 12.1% | 12.8% |
| Interquartile 25% (IQ1) | 9.2% | 9.7% |
| Interquartile 75% (IQ3) | 22.4% | 17.1% |
| Interquartile Range (IQR) | 13.2% | 7.3% |
| Standard Deviation (Sample) | 12.2% | 14.4% |
| Standard Deviation (Population) | 12.1% | 14.3% |
Similar Demographics by Single Male Poverty
Demographics Similar to Samoans by Single Male Poverty
In terms of single male poverty, the demographic groups most similar to Samoans are Bulgarian (11.7%, a difference of 0.10%), Immigrants from Uzbekistan (11.7%, a difference of 0.12%), Cypriot (11.7%, a difference of 0.29%), Paraguayan (11.6%, a difference of 0.31%), and Immigrants from Lithuania (11.6%, a difference of 0.42%).
| Demographics | Rating | Rank | Single Male Poverty |
| Immigrants | Poland | 99.9 /100 | #45 | Exceptional 11.5% |
| Immigrants | Bulgaria | 99.9 /100 | #46 | Exceptional 11.6% |
| Nepalese | 99.9 /100 | #47 | Exceptional 11.6% |
| Immigrants | Indonesia | 99.9 /100 | #48 | Exceptional 11.6% |
| Tlingit-Haida | 99.9 /100 | #49 | Exceptional 11.6% |
| Immigrants | Lithuania | 99.9 /100 | #50 | Exceptional 11.6% |
| Paraguayans | 99.9 /100 | #51 | Exceptional 11.6% |
| Samoans | 99.9 /100 | #52 | Exceptional 11.7% |
| Bulgarians | 99.9 /100 | #53 | Exceptional 11.7% |
| Immigrants | Uzbekistan | 99.9 /100 | #54 | Exceptional 11.7% |
| Cypriots | 99.9 /100 | #55 | Exceptional 11.7% |
| Burmese | 99.8 /100 | #56 | Exceptional 11.7% |
| Immigrants | Romania | 99.8 /100 | #57 | Exceptional 11.7% |
| Immigrants | Brazil | 99.8 /100 | #58 | Exceptional 11.7% |
| Brazilians | 99.8 /100 | #59 | Exceptional 11.8% |
Demographics Similar to Immigrants from Jordan by Single Male Poverty
In terms of single male poverty, the demographic groups most similar to Immigrants from Jordan are Russian (12.5%, a difference of 0.030%), Immigrants from Kenya (12.5%, a difference of 0.060%), Romanian (12.5%, a difference of 0.080%), Serbian (12.5%, a difference of 0.10%), and Immigrants from Netherlands (12.5%, a difference of 0.10%).
| Demographics | Rating | Rank | Single Male Poverty |
| Albanians | 90.6 /100 | #118 | Exceptional 12.4% |
| Immigrants | Albania | 90.3 /100 | #119 | Exceptional 12.4% |
| Venezuelans | 89.4 /100 | #120 | Excellent 12.4% |
| Icelanders | 88.2 /100 | #121 | Excellent 12.5% |
| Serbians | 87.9 /100 | #122 | Excellent 12.5% |
| Immigrants | Kenya | 87.6 /100 | #123 | Excellent 12.5% |
| Russians | 87.3 /100 | #124 | Excellent 12.5% |
| Immigrants | Jordan | 87.1 /100 | #125 | Excellent 12.5% |
| Romanians | 86.4 /100 | #126 | Excellent 12.5% |
| Immigrants | Netherlands | 86.2 /100 | #127 | Excellent 12.5% |
| Ecuadorians | 85.9 /100 | #128 | Excellent 12.5% |
| Immigrants | Sierra Leone | 85.5 /100 | #129 | Excellent 12.5% |
| Immigrants | Nicaragua | 84.8 /100 | #130 | Excellent 12.5% |
| Immigrants | Northern Europe | 83.7 /100 | #131 | Excellent 12.5% |
| Salvadorans | 83.7 /100 | #132 | Excellent 12.5% |