Creek vs Immigrants from Jordan Single Male Poverty
COMPARE
Creek
Immigrants from Jordan
Single Male Poverty
Single Male Poverty Comparison
Creek
Immigrants from Jordan
16.8%
SINGLE MALE POVERTY
0.0/ 100
METRIC RATING
323rd/ 347
METRIC RANK
12.5%
SINGLE MALE POVERTY
87.1/ 100
METRIC RATING
125th/ 347
METRIC RANK
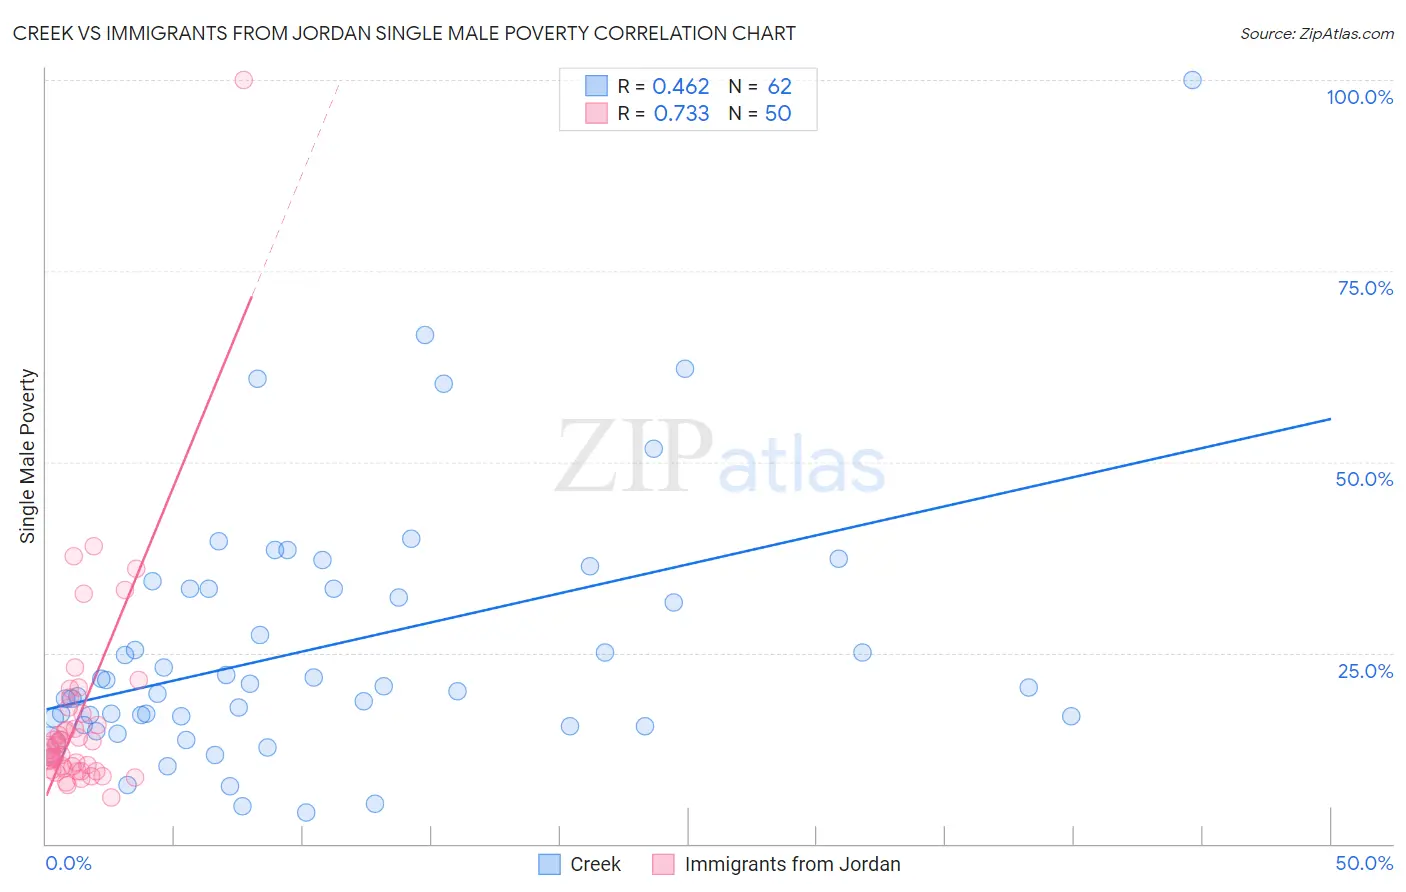
Creek vs Immigrants from Jordan Single Male Poverty Correlation Chart
The statistical analysis conducted on geographies consisting of 168,159,894 people shows a moderate positive correlation between the proportion of Creek and poverty level among single males in the United States with a correlation coefficient (R) of 0.462 and weighted average of 16.8%. Similarly, the statistical analysis conducted on geographies consisting of 169,036,341 people shows a strong positive correlation between the proportion of Immigrants from Jordan and poverty level among single males in the United States with a correlation coefficient (R) of 0.733 and weighted average of 12.5%, a difference of 35.0%.
Single Male Poverty Correlation Summary
| Measurement | Creek | Immigrants from Jordan |
| Minimum | 4.0% | 6.0% |
| Maximum | 100.0% | 100.0% |
| Range | 96.0% | 94.0% |
| Mean | 25.8% | 16.7% |
| Median | 20.6% | 12.8% |
| Interquartile 25% (IQ1) | 16.5% | 9.7% |
| Interquartile 75% (IQ3) | 33.3% | 17.1% |
| Interquartile Range (IQR) | 16.9% | 7.3% |
| Standard Deviation (Sample) | 17.0% | 14.4% |
| Standard Deviation (Population) | 16.9% | 14.3% |
Similar Demographics by Single Male Poverty
Demographics Similar to Creek by Single Male Poverty
In terms of single male poverty, the demographic groups most similar to Creek are Immigrants from Yemen (16.9%, a difference of 0.11%), Choctaw (17.0%, a difference of 0.83%), Shoshone (16.7%, a difference of 1.0%), Osage (16.5%, a difference of 2.3%), and Marshallese (16.4%, a difference of 2.4%).
| Demographics | Rating | Rank | Single Male Poverty |
| Dutch West Indians | 0.0 /100 | #316 | Tragic 16.1% |
| Blacks/African Americans | 0.0 /100 | #317 | Tragic 16.2% |
| Chickasaw | 0.0 /100 | #318 | Tragic 16.3% |
| Chippewa | 0.0 /100 | #319 | Tragic 16.4% |
| Marshallese | 0.0 /100 | #320 | Tragic 16.4% |
| Osage | 0.0 /100 | #321 | Tragic 16.5% |
| Shoshone | 0.0 /100 | #322 | Tragic 16.7% |
| Creek | 0.0 /100 | #323 | Tragic 16.8% |
| Immigrants | Yemen | 0.0 /100 | #324 | Tragic 16.9% |
| Choctaw | 0.0 /100 | #325 | Tragic 17.0% |
| Central American Indians | 0.0 /100 | #326 | Tragic 17.2% |
| Menominee | 0.0 /100 | #327 | Tragic 17.7% |
| Kiowa | 0.0 /100 | #328 | Tragic 18.3% |
| Colville | 0.0 /100 | #329 | Tragic 18.4% |
| Cajuns | 0.0 /100 | #330 | Tragic 19.1% |
Demographics Similar to Immigrants from Jordan by Single Male Poverty
In terms of single male poverty, the demographic groups most similar to Immigrants from Jordan are Russian (12.5%, a difference of 0.030%), Immigrants from Kenya (12.5%, a difference of 0.060%), Romanian (12.5%, a difference of 0.080%), Serbian (12.5%, a difference of 0.10%), and Immigrants from Netherlands (12.5%, a difference of 0.10%).
| Demographics | Rating | Rank | Single Male Poverty |
| Albanians | 90.6 /100 | #118 | Exceptional 12.4% |
| Immigrants | Albania | 90.3 /100 | #119 | Exceptional 12.4% |
| Venezuelans | 89.4 /100 | #120 | Excellent 12.4% |
| Icelanders | 88.2 /100 | #121 | Excellent 12.5% |
| Serbians | 87.9 /100 | #122 | Excellent 12.5% |
| Immigrants | Kenya | 87.6 /100 | #123 | Excellent 12.5% |
| Russians | 87.3 /100 | #124 | Excellent 12.5% |
| Immigrants | Jordan | 87.1 /100 | #125 | Excellent 12.5% |
| Romanians | 86.4 /100 | #126 | Excellent 12.5% |
| Immigrants | Netherlands | 86.2 /100 | #127 | Excellent 12.5% |
| Ecuadorians | 85.9 /100 | #128 | Excellent 12.5% |
| Immigrants | Sierra Leone | 85.5 /100 | #129 | Excellent 12.5% |
| Immigrants | Nicaragua | 84.8 /100 | #130 | Excellent 12.5% |
| Immigrants | Northern Europe | 83.7 /100 | #131 | Excellent 12.5% |
| Salvadorans | 83.7 /100 | #132 | Excellent 12.5% |