Russian vs Inupiat Receiving Food Stamps
COMPARE
Russian
Inupiat
Receiving Food Stamps
Receiving Food Stamps Comparison
Russians
Inupiat
9.6%
RECEIVING FOOD STAMPS
99.4/ 100
METRIC RATING
48th/ 347
METRIC RANK
20.1%
RECEIVING FOOD STAMPS
0.0/ 100
METRIC RATING
333rd/ 347
METRIC RANK
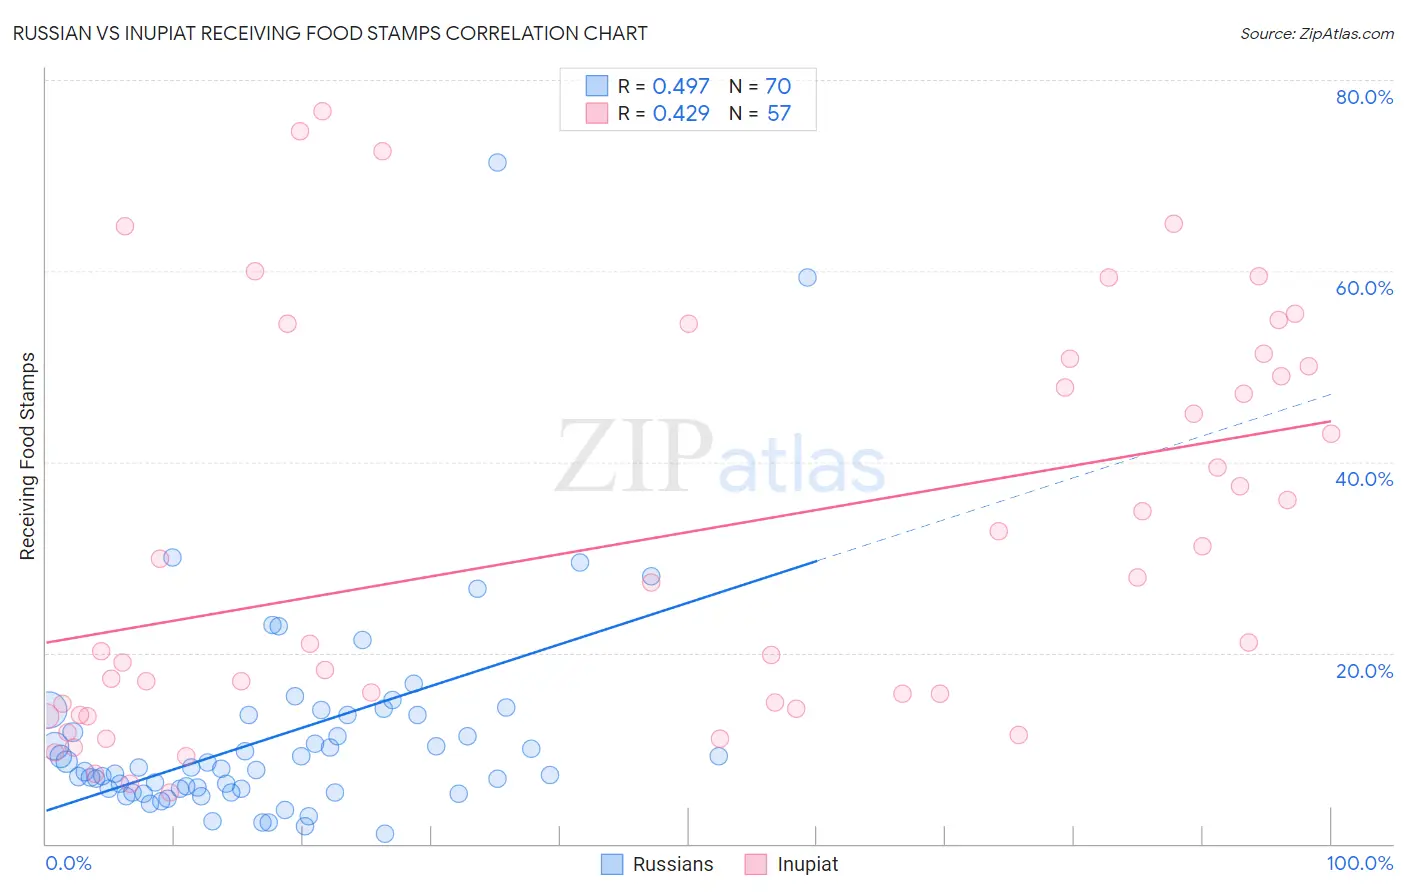
Russian vs Inupiat Receiving Food Stamps Correlation Chart
The statistical analysis conducted on geographies consisting of 509,493,528 people shows a moderate positive correlation between the proportion of Russians and percentage of population receiving government assistance and/or food stamps in the United States with a correlation coefficient (R) of 0.497 and weighted average of 9.6%. Similarly, the statistical analysis conducted on geographies consisting of 96,290,078 people shows a moderate positive correlation between the proportion of Inupiat and percentage of population receiving government assistance and/or food stamps in the United States with a correlation coefficient (R) of 0.429 and weighted average of 20.1%, a difference of 108.0%.
Receiving Food Stamps Correlation Summary
| Measurement | Russian | Inupiat |
| Minimum | 1.0% | 5.4% |
| Maximum | 71.4% | 76.7% |
| Range | 70.4% | 71.3% |
| Mean | 11.4% | 32.0% |
| Median | 7.9% | 27.3% |
| Interquartile 25% (IQ1) | 5.7% | 14.4% |
| Interquartile 75% (IQ3) | 13.5% | 50.4% |
| Interquartile Range (IQR) | 7.8% | 36.0% |
| Standard Deviation (Sample) | 11.4% | 20.6% |
| Standard Deviation (Population) | 11.3% | 20.4% |
Similar Demographics by Receiving Food Stamps
Demographics Similar to Russians by Receiving Food Stamps
In terms of receiving food stamps, the demographic groups most similar to Russians are Immigrants from Czechoslovakia (9.6%, a difference of 0.020%), Indian (Asian) (9.6%, a difference of 0.11%), Australian (9.6%, a difference of 0.17%), Immigrants from Belgium (9.6%, a difference of 0.25%), and Lithuanian (9.7%, a difference of 0.27%).
| Demographics | Rating | Rank | Receiving Food Stamps |
| Cambodians | 99.5 /100 | #41 | Exceptional 9.5% |
| Immigrants | China | 99.5 /100 | #42 | Exceptional 9.6% |
| Croatians | 99.5 /100 | #43 | Exceptional 9.6% |
| Immigrants | Denmark | 99.4 /100 | #44 | Exceptional 9.6% |
| Immigrants | Belgium | 99.4 /100 | #45 | Exceptional 9.6% |
| Australians | 99.4 /100 | #46 | Exceptional 9.6% |
| Indians (Asian) | 99.4 /100 | #47 | Exceptional 9.6% |
| Russians | 99.4 /100 | #48 | Exceptional 9.6% |
| Immigrants | Czechoslovakia | 99.4 /100 | #49 | Exceptional 9.6% |
| Lithuanians | 99.4 /100 | #50 | Exceptional 9.7% |
| Asians | 99.3 /100 | #51 | Exceptional 9.7% |
| Immigrants | South Africa | 99.3 /100 | #52 | Exceptional 9.7% |
| Tongans | 99.3 /100 | #53 | Exceptional 9.7% |
| Swiss | 99.3 /100 | #54 | Exceptional 9.7% |
| Immigrants | Switzerland | 99.3 /100 | #55 | Exceptional 9.7% |
Demographics Similar to Inupiat by Receiving Food Stamps
In terms of receiving food stamps, the demographic groups most similar to Inupiat are Pueblo (19.9%, a difference of 0.73%), Yuman (20.2%, a difference of 0.86%), Immigrants from Caribbean (19.6%, a difference of 2.2%), Immigrants from Cuba (20.8%, a difference of 3.8%), and Navajo (21.1%, a difference of 5.0%).
| Demographics | Rating | Rank | Receiving Food Stamps |
| Cubans | 0.0 /100 | #326 | Tragic 18.2% |
| Apache | 0.0 /100 | #327 | Tragic 18.3% |
| Colville | 0.0 /100 | #328 | Tragic 18.3% |
| Immigrants | Dominica | 0.0 /100 | #329 | Tragic 18.4% |
| Pima | 0.0 /100 | #330 | Tragic 19.0% |
| Immigrants | Caribbean | 0.0 /100 | #331 | Tragic 19.6% |
| Pueblo | 0.0 /100 | #332 | Tragic 19.9% |
| Inupiat | 0.0 /100 | #333 | Tragic 20.1% |
| Yuman | 0.0 /100 | #334 | Tragic 20.2% |
| Immigrants | Cuba | 0.0 /100 | #335 | Tragic 20.8% |
| Navajo | 0.0 /100 | #336 | Tragic 21.1% |
| Cape Verdeans | 0.0 /100 | #337 | Tragic 21.1% |
| Dominicans | 0.0 /100 | #338 | Tragic 21.4% |
| Yakama | 0.0 /100 | #339 | Tragic 21.4% |
| Tohono O'odham | 0.0 /100 | #340 | Tragic 21.5% |