Pakistani vs Inupiat Receiving Food Stamps
COMPARE
Pakistani
Inupiat
Receiving Food Stamps
Receiving Food Stamps Comparison
Pakistanis
Inupiat
10.4%
RECEIVING FOOD STAMPS
95.9/ 100
METRIC RATING
110th/ 347
METRIC RANK
20.1%
RECEIVING FOOD STAMPS
0.0/ 100
METRIC RATING
333rd/ 347
METRIC RANK
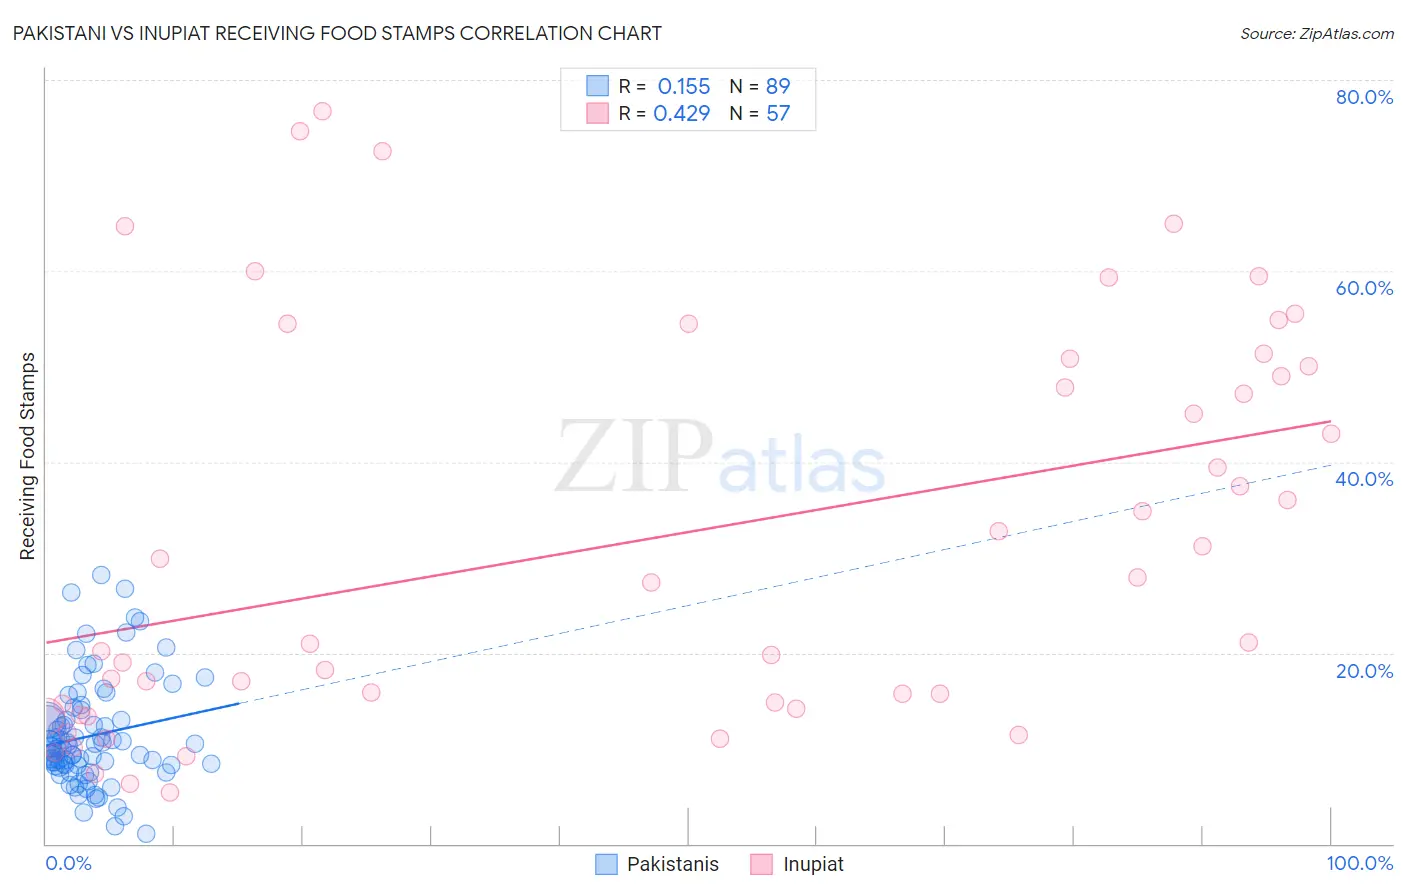
Pakistani vs Inupiat Receiving Food Stamps Correlation Chart
The statistical analysis conducted on geographies consisting of 334,714,196 people shows a poor positive correlation between the proportion of Pakistanis and percentage of population receiving government assistance and/or food stamps in the United States with a correlation coefficient (R) of 0.155 and weighted average of 10.4%. Similarly, the statistical analysis conducted on geographies consisting of 96,290,078 people shows a moderate positive correlation between the proportion of Inupiat and percentage of population receiving government assistance and/or food stamps in the United States with a correlation coefficient (R) of 0.429 and weighted average of 20.1%, a difference of 92.1%.
Receiving Food Stamps Correlation Summary
| Measurement | Pakistani | Inupiat |
| Minimum | 1.1% | 5.4% |
| Maximum | 28.2% | 76.7% |
| Range | 27.1% | 71.3% |
| Mean | 11.3% | 32.0% |
| Median | 10.1% | 27.3% |
| Interquartile 25% (IQ1) | 8.2% | 14.4% |
| Interquartile 75% (IQ3) | 13.5% | 50.4% |
| Interquartile Range (IQR) | 5.3% | 36.0% |
| Standard Deviation (Sample) | 5.6% | 20.6% |
| Standard Deviation (Population) | 5.6% | 20.4% |
Similar Demographics by Receiving Food Stamps
Demographics Similar to Pakistanis by Receiving Food Stamps
In terms of receiving food stamps, the demographic groups most similar to Pakistanis are Romanian (10.4%, a difference of 0.10%), Mongolian (10.5%, a difference of 0.11%), Immigrants from Pakistan (10.4%, a difference of 0.28%), Carpatho Rusyn (10.4%, a difference of 0.33%), and Korean (10.4%, a difference of 0.36%).
| Demographics | Rating | Rank | Receiving Food Stamps |
| Immigrants | Latvia | 96.8 /100 | #103 | Exceptional 10.3% |
| Immigrants | Hungary | 96.7 /100 | #104 | Exceptional 10.3% |
| Immigrants | Malaysia | 96.5 /100 | #105 | Exceptional 10.4% |
| Immigrants | Italy | 96.4 /100 | #106 | Exceptional 10.4% |
| Koreans | 96.3 /100 | #107 | Exceptional 10.4% |
| Carpatho Rusyns | 96.2 /100 | #108 | Exceptional 10.4% |
| Immigrants | Pakistan | 96.2 /100 | #109 | Exceptional 10.4% |
| Pakistanis | 95.9 /100 | #110 | Exceptional 10.4% |
| Romanians | 95.8 /100 | #111 | Exceptional 10.4% |
| Mongolians | 95.8 /100 | #112 | Exceptional 10.5% |
| Icelanders | 95.4 /100 | #113 | Exceptional 10.5% |
| Scotch-Irish | 95.1 /100 | #114 | Exceptional 10.5% |
| Immigrants | Saudi Arabia | 94.9 /100 | #115 | Exceptional 10.5% |
| Canadians | 94.8 /100 | #116 | Exceptional 10.5% |
| Immigrants | Nepal | 94.6 /100 | #117 | Exceptional 10.6% |
Demographics Similar to Inupiat by Receiving Food Stamps
In terms of receiving food stamps, the demographic groups most similar to Inupiat are Pueblo (19.9%, a difference of 0.73%), Yuman (20.2%, a difference of 0.86%), Immigrants from Caribbean (19.6%, a difference of 2.2%), Immigrants from Cuba (20.8%, a difference of 3.8%), and Navajo (21.1%, a difference of 5.0%).
| Demographics | Rating | Rank | Receiving Food Stamps |
| Cubans | 0.0 /100 | #326 | Tragic 18.2% |
| Apache | 0.0 /100 | #327 | Tragic 18.3% |
| Colville | 0.0 /100 | #328 | Tragic 18.3% |
| Immigrants | Dominica | 0.0 /100 | #329 | Tragic 18.4% |
| Pima | 0.0 /100 | #330 | Tragic 19.0% |
| Immigrants | Caribbean | 0.0 /100 | #331 | Tragic 19.6% |
| Pueblo | 0.0 /100 | #332 | Tragic 19.9% |
| Inupiat | 0.0 /100 | #333 | Tragic 20.1% |
| Yuman | 0.0 /100 | #334 | Tragic 20.2% |
| Immigrants | Cuba | 0.0 /100 | #335 | Tragic 20.8% |
| Navajo | 0.0 /100 | #336 | Tragic 21.1% |
| Cape Verdeans | 0.0 /100 | #337 | Tragic 21.1% |
| Dominicans | 0.0 /100 | #338 | Tragic 21.4% |
| Yakama | 0.0 /100 | #339 | Tragic 21.4% |
| Tohono O'odham | 0.0 /100 | #340 | Tragic 21.5% |