Puget Sound Salish vs Laotian Male Poverty
COMPARE
Puget Sound Salish
Laotian
Male Poverty
Male Poverty Comparison
Puget Sound Salish
Laotians
10.7%
MALE POVERTY
84.3/ 100
METRIC RATING
127th/ 347
METRIC RANK
10.5%
MALE POVERTY
91.2/ 100
METRIC RATING
107th/ 347
METRIC RANK
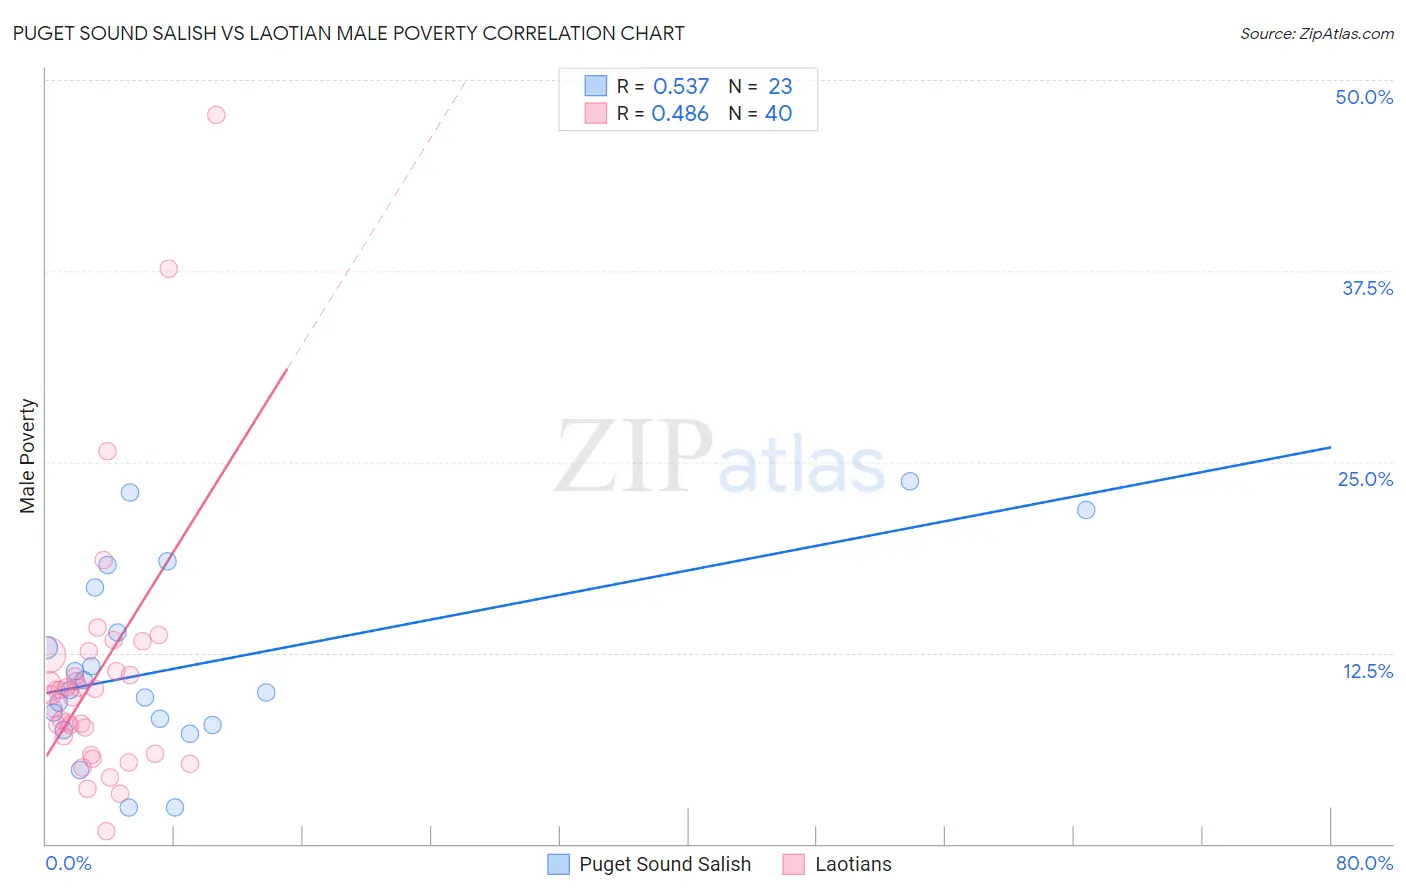
Puget Sound Salish vs Laotian Male Poverty Correlation Chart
The statistical analysis conducted on geographies consisting of 46,147,564 people shows a substantial positive correlation between the proportion of Puget Sound Salish and poverty level among males in the United States with a correlation coefficient (R) of 0.537 and weighted average of 10.7%. Similarly, the statistical analysis conducted on geographies consisting of 224,721,860 people shows a moderate positive correlation between the proportion of Laotians and poverty level among males in the United States with a correlation coefficient (R) of 0.486 and weighted average of 10.5%, a difference of 1.7%.
Male Poverty Correlation Summary
| Measurement | Puget Sound Salish | Laotian |
| Minimum | 2.4% | 0.78% |
| Maximum | 23.8% | 47.7% |
| Range | 21.4% | 46.9% |
| Mean | 11.7% | 11.0% |
| Median | 10.1% | 9.9% |
| Interquartile 25% (IQ1) | 7.8% | 6.5% |
| Interquartile 75% (IQ3) | 16.7% | 11.8% |
| Interquartile Range (IQR) | 9.0% | 5.4% |
| Standard Deviation (Sample) | 6.1% | 8.6% |
| Standard Deviation (Population) | 5.9% | 8.5% |
Demographics Similar to Puget Sound Salish and Laotians by Male Poverty
In terms of male poverty, the demographic groups most similar to Puget Sound Salish are Immigrants from Ukraine (10.7%, a difference of 0.0%), Immigrants from Norway (10.7%, a difference of 0.35%), French (10.7%, a difference of 0.50%), South African (10.7%, a difference of 0.53%), and Native Hawaiian (10.7%, a difference of 0.57%). Similarly, the demographic groups most similar to Laotians are Portuguese (10.6%, a difference of 0.070%), Albanian (10.6%, a difference of 0.21%), Argentinean (10.6%, a difference of 0.34%), Immigrants from Argentina (10.6%, a difference of 0.45%), and Immigrants from Turkey (10.6%, a difference of 0.53%).
| Demographics | Rating | Rank | Male Poverty |
| Laotians | 91.2 /100 | #107 | Exceptional 10.5% |
| Portuguese | 91.0 /100 | #108 | Exceptional 10.6% |
| Albanians | 90.6 /100 | #109 | Exceptional 10.6% |
| Argentineans | 90.1 /100 | #110 | Exceptional 10.6% |
| Immigrants | Argentina | 89.8 /100 | #111 | Excellent 10.6% |
| Immigrants | Turkey | 89.5 /100 | #112 | Excellent 10.6% |
| Palestinians | 89.1 /100 | #113 | Excellent 10.6% |
| Immigrants | Brazil | 89.0 /100 | #114 | Excellent 10.6% |
| Immigrants | Russia | 88.6 /100 | #115 | Excellent 10.6% |
| Sri Lankans | 88.1 /100 | #116 | Excellent 10.6% |
| Immigrants | South Eastern Asia | 88.1 /100 | #117 | Excellent 10.6% |
| Okinawans | 87.6 /100 | #118 | Excellent 10.7% |
| Immigrants | Hungary | 87.6 /100 | #119 | Excellent 10.7% |
| Immigrants | China | 87.1 /100 | #120 | Excellent 10.7% |
| Peruvians | 87.1 /100 | #121 | Excellent 10.7% |
| Native Hawaiians | 87.0 /100 | #122 | Excellent 10.7% |
| South Africans | 86.8 /100 | #123 | Excellent 10.7% |
| French | 86.7 /100 | #124 | Excellent 10.7% |
| Immigrants | Norway | 86.0 /100 | #125 | Excellent 10.7% |
| Immigrants | Ukraine | 84.3 /100 | #126 | Excellent 10.7% |
| Puget Sound Salish | 84.3 /100 | #127 | Excellent 10.7% |