Puget Sound Salish vs Costa Rican Female Poverty Among 25-34 Year Olds

COMPARE

Puget Sound Salish
Race
Ancestry
AfghanAfricanAlaska NativeAlaskan AthabascanAlbanianAleutAlsatianAmericanApacheArabArapahoArgentineanArmenianAssyrian/Chaldean/SyriacAustralianAustrianBahamianBangladeshiBarbadianBasqueBelgianBelizeanBermudanBhutaneseBlackfeetBolivianBrazilianBritishBritish West IndianBulgarianBurmeseCajunCambodianCanadianCape VerdeanCarpatho RusynCelticCentral AmericanCentral American IndianCherokeeCheyenneChickasawChileanChineseChippewaChoctawColombianColvilleComancheCreeCreekCroatianCrowCubanCypriotCzechCzechoslovakianDanishDelawareDominicanDutchDutch West IndianEastern EuropeanEcuadorianEgyptianEnglishEstonianEthiopianEuropeanFijianFilipinoFinnishFrenchFrench American IndianFrench CanadianGermanGerman RussianGhanaianGreekGuamanian/ChamorroGuatemalanGuyaneseHaitianHmongHonduranHopiHoumaHungarianIcelanderIndian (Asian)IndonesianInupiatIranianIraqiIrishIroquoisIsraeliItalianJamaicanJapaneseJordanianKenyanKiowaKoreanLaotianLatvianLebaneseLiberianLithuanianLumbeeLuxembourgerMacedonianMalaysianMalteseMarshalleseMenomineeMexicanMexican American IndianMongolianMoroccanNative HawaiianNavajoNepaleseNew ZealanderNicaraguanNigerianNorthern EuropeanNorwegianOkinawanOsageOttawaPaiutePakistaniPalestinianPanamanianParaguayanPennsylvania GermanPeruvianPimaPolishPortuguesePotawatomiPuebloPuerto RicanPuget Sound SalishRomanianRussianSalvadoranSamoanScandinavianScotch-IrishScottishSeminoleSenegaleseSerbianShoshoneSierra LeoneanSiouxSlavicSlovakSloveneSomaliSouth AfricanSouth AmericanSouth American IndianSoviet UnionSpaniardSpanishSpanish AmericanSpanish American IndianSri LankanSubsaharan AfricanSudaneseSwedishSwissSyrianTaiwaneseThaiTlingit-HaidaTohono O'OdhamTonganTrinidadian and TobagonianTsimshianTurkishU.S. Virgin IslanderUgandanUkrainianUruguayanUteVenezuelanVietnameseWelshWest IndianYakamaYaquiYugoslavianYumanYup'ikZimbabwean
Immigration
NonimmigrantsImmigrantsAfghanistanAfricaAlbaniaArgentinaArmeniaAsiaAustraliaAustriaBahamasBangladeshBarbadosBelarusBelgiumBelizeBoliviaBosnia and HerzegovinaBrazilBulgariaBurma/MyanmarCabo VerdeCambodiaCameroonCanadaCaribbeanCentral AmericaChileChinaColombiaCongoCosta RicaCroatiaCubaCzechoslovakiaDenmarkDominicaDominican RepublicEastern AfricaEastern AsiaEastern EuropeEcuadorEgyptEl SalvadorEnglandEritreaEthiopiaEuropeFijiFranceGermanyGhanaGreeceGrenadaGuatemalaGuyanaHaitiHondurasHong KongHungaryIndiaIndonesiaIranIraqIrelandIsraelItalyJamaicaJapanJordanKazakhstanKenyaKoreaKuwaitLaosLatin AmericaLatviaLebanonLiberiaLithuaniaMalaysiaMexicoMicronesiaMiddle AfricaMoldovaMoroccoNepalNetherlandsNicaraguaNigeriaNorth AmericaNorth MacedoniaNorthern AfricaNorthern EuropeNorwayOceaniaPakistanPanamaPeruPhilippinesPolandPortugalRomaniaRussiaSaudi ArabiaScotlandSenegalSerbiaSierra LeoneSingaporeSomaliaSouth AfricaSouth AmericaSouth Central AsiaSouth Eastern AsiaSouthern EuropeSpainSri LankaSt. Vincent and the GrenadinesSudanSwedenSwitzerlandSyriaTaiwanThailandTrinidad and TobagoTurkeyUgandaUkraineUruguayUzbekistanVenezuelaVietnamWest IndiesWestern AfricaWestern AsiaWestern EuropeYemenZaireZimbabweAzores
Costa Rican
Race
Ancestry
AfghanAfricanAlaska NativeAlaskan AthabascanAlbanianAleutAlsatianAmericanApacheArabArapahoArgentineanArmenianAssyrian/Chaldean/SyriacAustralianAustrianBahamianBangladeshiBarbadianBasqueBelgianBelizeanBermudanBhutaneseBlackfeetBolivianBrazilianBritishBritish West IndianBulgarianBurmeseCajunCambodianCanadianCape VerdeanCarpatho RusynCelticCentral AmericanCentral American IndianCherokeeCheyenneChickasawChileanChineseChippewaChoctawColombianColvilleComancheCosta RicanCreeCreekCroatianCrowCubanCypriotCzechCzechoslovakianDanishDelawareDominicanDutchDutch West IndianEastern EuropeanEcuadorianEgyptianEnglishEstonianEthiopianEuropeanFijianFilipinoFinnishFrenchFrench American IndianFrench CanadianGermanGerman RussianGhanaianGreekGuamanian/ChamorroGuatemalanGuyaneseHaitianHmongHonduranHopiHoumaHungarianIcelanderIndian (Asian)IndonesianInupiatIranianIraqiIrishIroquoisIsraeliItalianJamaicanJapaneseJordanianKenyanKiowaKoreanLaotianLatvianLebaneseLiberianLithuanianLumbeeLuxembourgerMacedonianMalaysianMalteseMarshalleseMenomineeMexicanMexican American IndianMongolianMoroccanNative HawaiianNavajoNepaleseNew ZealanderNicaraguanNigerianNorthern EuropeanNorwegianOkinawanOsageOttawaPaiutePakistaniPalestinianPanamanianParaguayanPennsylvania GermanPeruvianPimaPolishPortuguesePotawatomiPuebloPuerto RicanRomanianRussianSalvadoranSamoanScandinavianScotch-IrishScottishSeminoleSenegaleseSerbianShoshoneSierra LeoneanSiouxSlavicSlovakSloveneSomaliSouth AfricanSouth AmericanSouth American IndianSoviet UnionSpaniardSpanishSpanish AmericanSpanish American IndianSri LankanSubsaharan AfricanSudaneseSwedishSwissSyrianTaiwaneseThaiTlingit-HaidaTohono O'OdhamTonganTrinidadian and TobagonianTsimshianTurkishU.S. Virgin IslanderUgandanUkrainianUruguayanUteVenezuelanVietnameseWelshWest IndianYakamaYaquiYugoslavianYumanYup'ikZimbabwean
Immigration
NonimmigrantsImmigrantsAfghanistanAfricaAlbaniaArgentinaArmeniaAsiaAustraliaAustriaBahamasBangladeshBarbadosBelarusBelgiumBelizeBoliviaBosnia and HerzegovinaBrazilBulgariaBurma/MyanmarCabo VerdeCambodiaCameroonCanadaCaribbeanCentral AmericaChileChinaColombiaCongoCosta RicaCroatiaCubaCzechoslovakiaDenmarkDominicaDominican RepublicEastern AfricaEastern AsiaEastern EuropeEcuadorEgyptEl SalvadorEnglandEritreaEthiopiaEuropeFijiFranceGermanyGhanaGreeceGrenadaGuatemalaGuyanaHaitiHondurasHong KongHungaryIndiaIndonesiaIranIraqIrelandIsraelItalyJamaicaJapanJordanKazakhstanKenyaKoreaKuwaitLaosLatin AmericaLatviaLebanonLiberiaLithuaniaMalaysiaMexicoMicronesiaMiddle AfricaMoldovaMoroccoNepalNetherlandsNicaraguaNigeriaNorth AmericaNorth MacedoniaNorthern AfricaNorthern EuropeNorwayOceaniaPakistanPanamaPeruPhilippinesPolandPortugalRomaniaRussiaSaudi ArabiaScotlandSenegalSerbiaSierra LeoneSingaporeSomaliaSouth AfricaSouth AmericaSouth Central AsiaSouth Eastern AsiaSouthern EuropeSpainSri LankaSt. Vincent and the GrenadinesSudanSwedenSwitzerlandSyriaTaiwanThailandTrinidad and TobagoTurkeyUgandaUkraineUruguayUzbekistanVenezuelaVietnamWest IndiesWestern AfricaWestern AsiaWestern EuropeYemenZaireZimbabweAzores
Female Poverty Among 25-34 Year Olds
Income
Poverty
Unemployment
Labor Participation
Family Structure
Vehicle Availability
Education Level
Disability

Female Poverty Among 25-34 Year Olds Comparison

Puget Sound Salish

Costa Ricans

Tragic
Good
14.3%
FEMALE POVERTY AMONG 25-34 YEAR OLDS
6.5/ 100
METRIC RATING
213th/ 347
METRIC RANK
13.2%
FEMALE POVERTY AMONG 25-34 YEAR OLDS
75.8/ 100
METRIC RATING
151st/ 347
METRIC RANK

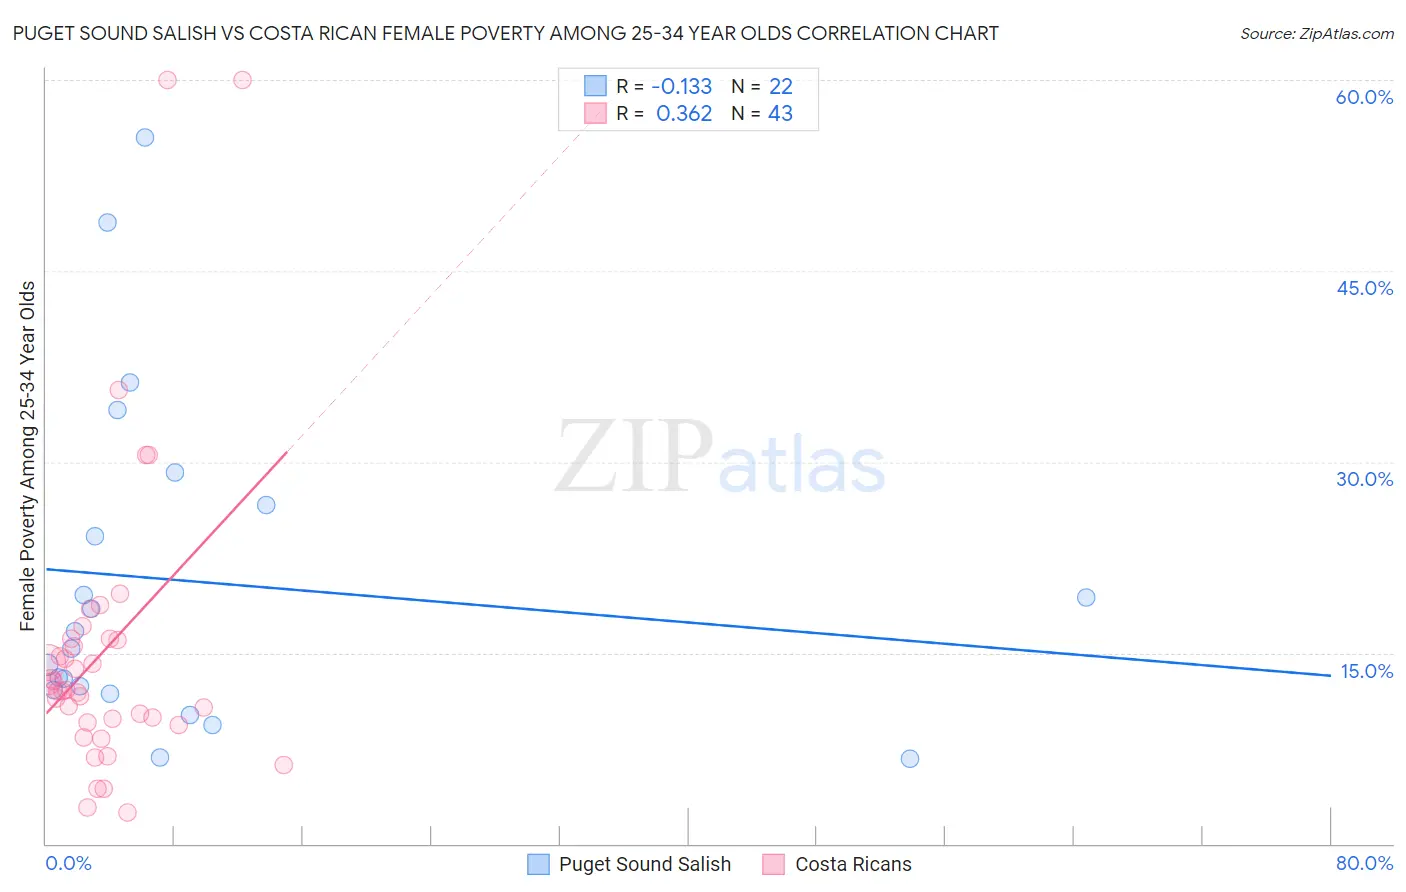
Puget Sound Salish vs Costa Rican Female Poverty Among 25-34 Year Olds Correlation Chart

The statistical analysis conducted on geographies consisting of 45,969,058 people shows a poor negative correlation between the proportion of Puget Sound Salish and poverty level among females between the ages 25 and 34 in the United States with a correlation coefficient (R) of -0.133 and weighted average of 14.3%. Similarly, the statistical analysis conducted on geographies consisting of 251,732,871 people shows a mild positive correlation between the proportion of Costa Ricans and poverty level among females between the ages 25 and 34 in the United States with a correlation coefficient (R) of 0.362 and weighted average of 13.2%, a difference of 8.1%.
Puget Sound Salish vs Costa Rican Female Poverty Among 25-34 Year Olds

Female Poverty Among 25-34 Year Olds Correlation Summary

MeasurementPuget Sound SalishCosta Rican
Minimum6.7%2.5%
Maximum55.5%60.0%
Range48.8%57.5%
Mean20.6%15.2%
Median16.0%12.1%
Interquartile 25% (IQ1)12.0%9.5%
Interquartile 75% (IQ3)26.6%16.1%
Interquartile Range (IQR)14.5%6.5%
Standard Deviation (Sample)13.1%12.1%
Standard Deviation (Population)12.8%11.9%

Similar Demographics by Female Poverty Among 25-34 Year Olds

Demographics Similar to Puget Sound Salish by Female Poverty Among 25-34 Year Olds

In terms of female poverty among 25-34 year olds, the demographic groups most similar to Puget Sound Salish are Immigrants from Guyana (14.3%, a difference of 0.030%), French (14.3%, a difference of 0.10%), Immigrants from Nigeria (14.3%, a difference of 0.12%), French Canadian (14.3%, a difference of 0.37%), and Spanish American Indian (14.3%, a difference of 0.38%).
DemographicsRating | RankFemale Poverty Among 25-34 Year Olds
Hungarians
11.8
/100
|
#206
Poor
14.1%
Japanese
11.7
/100
|
#207
Poor
14.1%
Immigrants | Panama
11.6
/100
|
#208
Poor
14.1%
Guyanese
8.6
/100
|
#209
Tragic
14.2%
Panamanians
8.6
/100
|
#210
Tragic
14.2%
Trinidadians and Tobagonians
8.2
/100
|
#211
Tragic
14.2%
Immigrants | Guyana
6.6
/100
|
#212
Tragic
14.3%
Puget Sound Salish
6.5
/100
|
#213
Tragic
14.3%
French
6.2
/100
|
#214
Tragic
14.3%
Immigrants | Nigeria
6.2
/100
|
#215
Tragic
14.3%
French Canadians
5.5
/100
|
#216
Tragic
14.3%
Spanish American Indians
5.5
/100
|
#217
Tragic
14.3%
Immigrants | Thailand
5.2
/100
|
#218
Tragic
14.3%
Ecuadorians
5.2
/100
|
#219
Tragic
14.3%
Ghanaians
4.8
/100
|
#220
Tragic
14.4%

Demographics Similar to Costa Ricans by Female Poverty Among 25-34 Year Olds

In terms of female poverty among 25-34 year olds, the demographic groups most similar to Costa Ricans are Slavic (13.2%, a difference of 0.010%), Iraqi (13.2%, a difference of 0.030%), Sierra Leonean (13.2%, a difference of 0.050%), European (13.2%, a difference of 0.12%), and Lebanese (13.2%, a difference of 0.12%).
DemographicsRating | RankFemale Poverty Among 25-34 Year Olds
Native Hawaiians
78.9
/100
|
#144
Good
13.2%
Colombians
77.2
/100
|
#145
Good
13.2%
South Americans
76.9
/100
|
#146
Good
13.2%
Europeans
76.8
/100
|
#147
Good
13.2%
Lebanese
76.8
/100
|
#148
Good
13.2%
Sierra Leoneans
76.3
/100
|
#149
Good
13.2%
Iraqis
76.0
/100
|
#150
Good
13.2%
Costa Ricans
75.8
/100
|
#151
Good
13.2%
Slavs
75.7
/100
|
#152
Good
13.2%
Northern Europeans
73.7
/100
|
#153
Good
13.2%
Arabs
73.5
/100
|
#154
Good
13.2%
Immigrants | Sierra Leone
72.9
/100
|
#155
Good
13.3%
Immigrants | Cameroon
72.0
/100
|
#156
Good
13.3%
Immigrants | Western Europe
70.3
/100
|
#157
Good
13.3%
Immigrants | Colombia
69.2
/100
|
#158
Good
13.3%