Immigrants from North Macedonia vs Costa Rican Female Poverty Among 25-34 Year Olds
COMPARE
Immigrants from North Macedonia
Costa Rican
Female Poverty Among 25-34 Year Olds
Female Poverty Among 25-34 Year Olds Comparison
Immigrants from North Macedonia
Costa Ricans
11.8%
FEMALE POVERTY AMONG 25-34 YEAR OLDS
99.8/ 100
METRIC RATING
38th/ 347
METRIC RANK
13.2%
FEMALE POVERTY AMONG 25-34 YEAR OLDS
75.8/ 100
METRIC RATING
151st/ 347
METRIC RANK
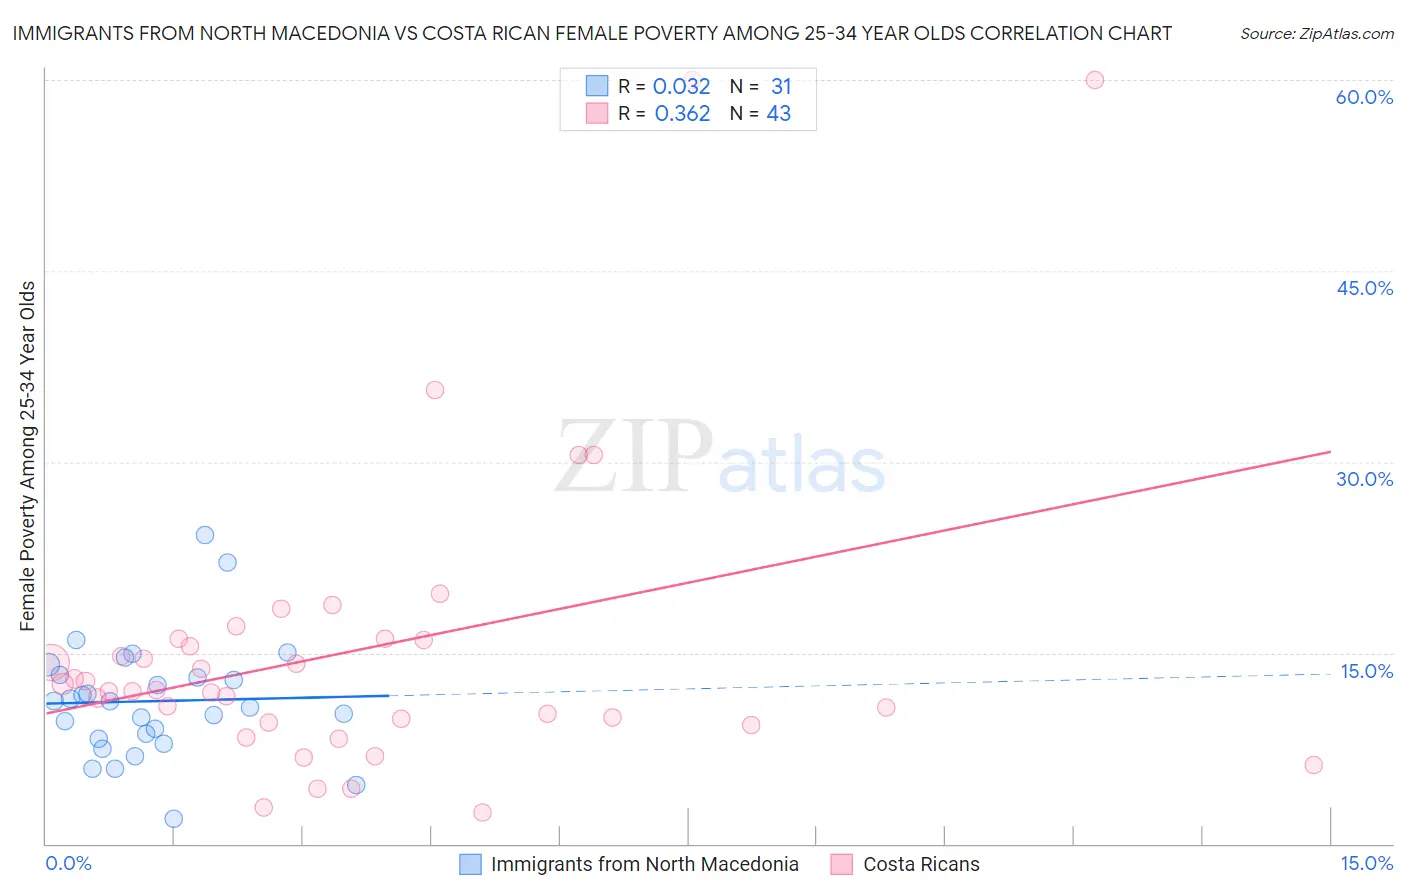
Immigrants from North Macedonia vs Costa Rican Female Poverty Among 25-34 Year Olds Correlation Chart
The statistical analysis conducted on geographies consisting of 73,602,403 people shows no correlation between the proportion of Immigrants from North Macedonia and poverty level among females between the ages 25 and 34 in the United States with a correlation coefficient (R) of 0.032 and weighted average of 11.8%. Similarly, the statistical analysis conducted on geographies consisting of 251,732,871 people shows a mild positive correlation between the proportion of Costa Ricans and poverty level among females between the ages 25 and 34 in the United States with a correlation coefficient (R) of 0.362 and weighted average of 13.2%, a difference of 12.2%.
Female Poverty Among 25-34 Year Olds Correlation Summary
| Measurement | Immigrants from North Macedonia | Costa Rican |
| Minimum | 2.0% | 2.5% |
| Maximum | 24.3% | 60.0% |
| Range | 22.3% | 57.5% |
| Mean | 11.2% | 15.2% |
| Median | 11.2% | 12.1% |
| Interquartile 25% (IQ1) | 8.2% | 9.5% |
| Interquartile 75% (IQ3) | 13.3% | 16.1% |
| Interquartile Range (IQR) | 5.0% | 6.5% |
| Standard Deviation (Sample) | 4.6% | 12.1% |
| Standard Deviation (Population) | 4.5% | 11.9% |
Similar Demographics by Female Poverty Among 25-34 Year Olds
Demographics Similar to Immigrants from North Macedonia by Female Poverty Among 25-34 Year Olds
In terms of female poverty among 25-34 year olds, the demographic groups most similar to Immigrants from North Macedonia are Taiwanese (11.8%, a difference of 0.070%), Immigrants from Sri Lanka (11.8%, a difference of 0.23%), Latvian (11.8%, a difference of 0.25%), Immigrants from Bulgaria (11.8%, a difference of 0.41%), and Immigrants from Indonesia (11.8%, a difference of 0.54%).
| Demographics | Rating | Rank | Female Poverty Among 25-34 Year Olds |
| Immigrants | Japan | 99.9 /100 | #31 | Exceptional 11.6% |
| Immigrants | Asia | 99.9 /100 | #32 | Exceptional 11.6% |
| Immigrants | Poland | 99.9 /100 | #33 | Exceptional 11.6% |
| Zimbabweans | 99.9 /100 | #34 | Exceptional 11.7% |
| Cambodians | 99.9 /100 | #35 | Exceptional 11.7% |
| Immigrants | Sri Lanka | 99.8 /100 | #36 | Exceptional 11.8% |
| Taiwanese | 99.8 /100 | #37 | Exceptional 11.8% |
| Immigrants | North Macedonia | 99.8 /100 | #38 | Exceptional 11.8% |
| Latvians | 99.8 /100 | #39 | Exceptional 11.8% |
| Immigrants | Bulgaria | 99.8 /100 | #40 | Exceptional 11.8% |
| Immigrants | Indonesia | 99.8 /100 | #41 | Exceptional 11.8% |
| Immigrants | Turkey | 99.7 /100 | #42 | Exceptional 11.9% |
| Egyptians | 99.7 /100 | #43 | Exceptional 11.9% |
| Immigrants | Australia | 99.7 /100 | #44 | Exceptional 11.9% |
| Macedonians | 99.7 /100 | #45 | Exceptional 11.9% |
Demographics Similar to Costa Ricans by Female Poverty Among 25-34 Year Olds
In terms of female poverty among 25-34 year olds, the demographic groups most similar to Costa Ricans are Slavic (13.2%, a difference of 0.010%), Iraqi (13.2%, a difference of 0.030%), Sierra Leonean (13.2%, a difference of 0.050%), European (13.2%, a difference of 0.12%), and Lebanese (13.2%, a difference of 0.12%).
| Demographics | Rating | Rank | Female Poverty Among 25-34 Year Olds |
| Native Hawaiians | 78.9 /100 | #144 | Good 13.2% |
| Colombians | 77.2 /100 | #145 | Good 13.2% |
| South Americans | 76.9 /100 | #146 | Good 13.2% |
| Europeans | 76.8 /100 | #147 | Good 13.2% |
| Lebanese | 76.8 /100 | #148 | Good 13.2% |
| Sierra Leoneans | 76.3 /100 | #149 | Good 13.2% |
| Iraqis | 76.0 /100 | #150 | Good 13.2% |
| Costa Ricans | 75.8 /100 | #151 | Good 13.2% |
| Slavs | 75.7 /100 | #152 | Good 13.2% |
| Northern Europeans | 73.7 /100 | #153 | Good 13.2% |
| Arabs | 73.5 /100 | #154 | Good 13.2% |
| Immigrants | Sierra Leone | 72.9 /100 | #155 | Good 13.3% |
| Immigrants | Cameroon | 72.0 /100 | #156 | Good 13.3% |
| Immigrants | Western Europe | 70.3 /100 | #157 | Good 13.3% |
| Immigrants | Colombia | 69.2 /100 | #158 | Good 13.3% |