Puerto Rican vs Slovene Single Mother Poverty
COMPARE
Puerto Rican
Slovene
Single Mother Poverty
Single Mother Poverty Comparison
Puerto Ricans
Slovenes
44.5%
SINGLE MOTHER POVERTY
0.0/ 100
METRIC RATING
347th/ 347
METRIC RANK
28.8%
SINGLE MOTHER POVERTY
76.4/ 100
METRIC RATING
153rd/ 347
METRIC RANK
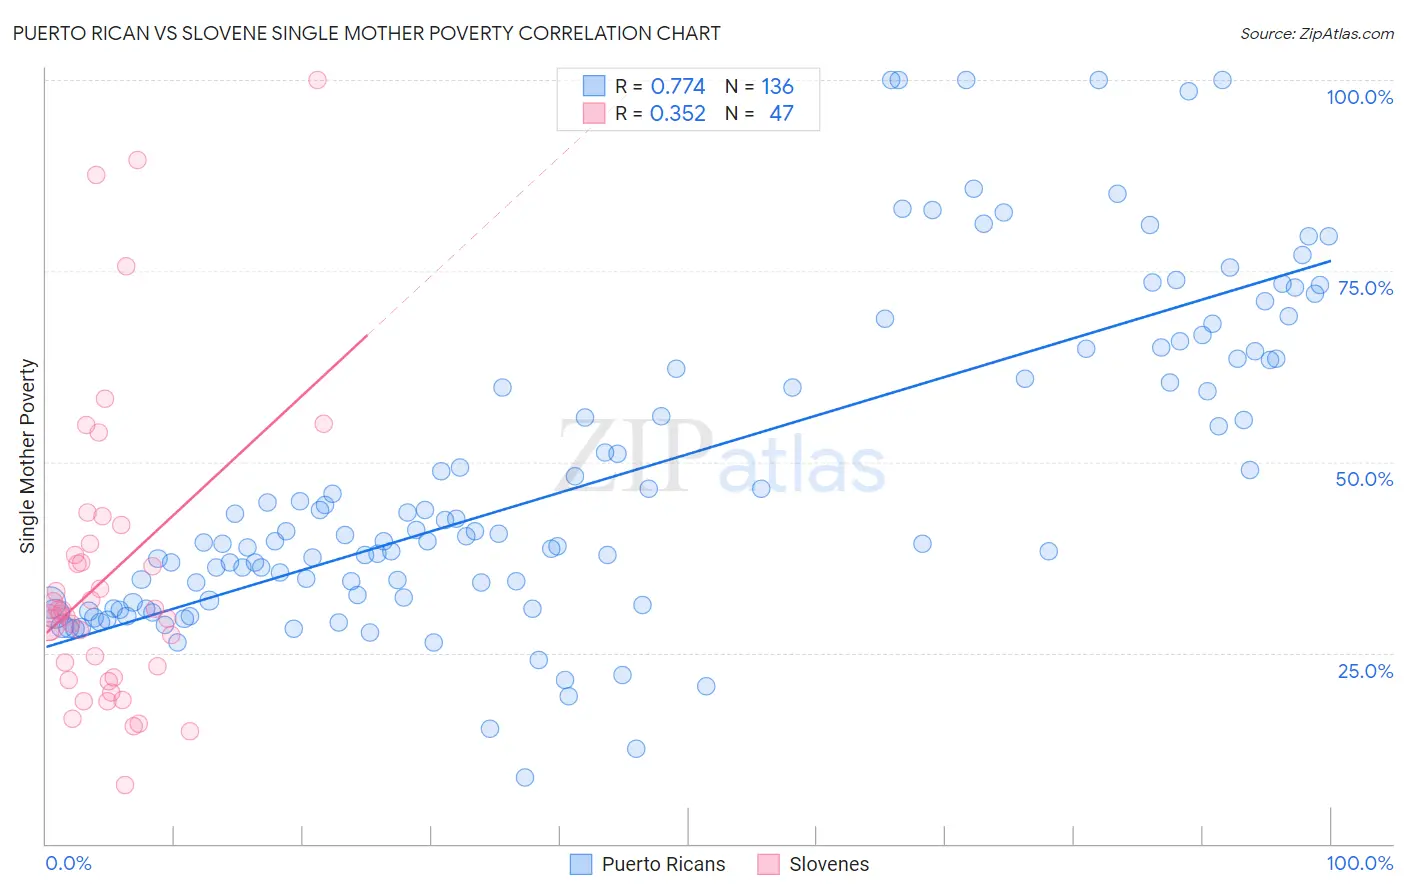
Puerto Rican vs Slovene Single Mother Poverty Correlation Chart
The statistical analysis conducted on geographies consisting of 509,350,600 people shows a strong positive correlation between the proportion of Puerto Ricans and poverty level among single mothers in the United States with a correlation coefficient (R) of 0.774 and weighted average of 44.5%. Similarly, the statistical analysis conducted on geographies consisting of 255,975,131 people shows a mild positive correlation between the proportion of Slovenes and poverty level among single mothers in the United States with a correlation coefficient (R) of 0.352 and weighted average of 28.8%, a difference of 54.9%.
Single Mother Poverty Correlation Summary
| Measurement | Puerto Rican | Slovene |
| Minimum | 8.7% | 7.7% |
| Maximum | 100.0% | 100.0% |
| Range | 91.3% | 92.3% |
| Mean | 47.8% | 35.2% |
| Median | 40.4% | 30.1% |
| Interquartile 25% (IQ1) | 31.7% | 21.7% |
| Interquartile 75% (IQ3) | 63.4% | 39.2% |
| Interquartile Range (IQR) | 31.7% | 17.5% |
| Standard Deviation (Sample) | 20.8% | 19.9% |
| Standard Deviation (Population) | 20.8% | 19.6% |
Similar Demographics by Single Mother Poverty
Demographics Similar to Puerto Ricans by Single Mother Poverty
In terms of single mother poverty, the demographic groups most similar to Puerto Ricans are Houma (43.5%, a difference of 2.4%), Lumbee (43.2%, a difference of 3.0%), Tohono O'odham (43.0%, a difference of 3.5%), Cajun (40.3%, a difference of 10.4%), and Navajo (40.2%, a difference of 10.8%).
| Demographics | Rating | Rank | Single Mother Poverty |
| Menominee | 0.0 /100 | #333 | Tragic 37.1% |
| Pueblo | 0.0 /100 | #334 | Tragic 37.2% |
| Yuman | 0.0 /100 | #335 | Tragic 37.8% |
| Cheyenne | 0.0 /100 | #336 | Tragic 38.5% |
| Immigrants | Yemen | 0.0 /100 | #337 | Tragic 38.5% |
| Pima | 0.0 /100 | #338 | Tragic 38.6% |
| Crow | 0.0 /100 | #339 | Tragic 38.6% |
| Sioux | 0.0 /100 | #340 | Tragic 38.8% |
| Colville | 0.0 /100 | #341 | Tragic 39.3% |
| Navajo | 0.0 /100 | #342 | Tragic 40.2% |
| Cajuns | 0.0 /100 | #343 | Tragic 40.3% |
| Tohono O'odham | 0.0 /100 | #344 | Tragic 43.0% |
| Lumbee | 0.0 /100 | #345 | Tragic 43.2% |
| Houma | 0.0 /100 | #346 | Tragic 43.5% |
| Puerto Ricans | 0.0 /100 | #347 | Tragic 44.5% |
Demographics Similar to Slovenes by Single Mother Poverty
In terms of single mother poverty, the demographic groups most similar to Slovenes are Austrian (28.7%, a difference of 0.18%), Portuguese (28.8%, a difference of 0.21%), Immigrants from Oceania (28.7%, a difference of 0.25%), Ugandan (28.8%, a difference of 0.29%), and Iraqi (28.8%, a difference of 0.31%).
| Demographics | Rating | Rank | Single Mother Poverty |
| Immigrants | Denmark | 86.1 /100 | #146 | Excellent 28.5% |
| Immigrants | Lebanon | 85.3 /100 | #147 | Excellent 28.6% |
| Syrians | 85.3 /100 | #148 | Excellent 28.6% |
| Serbians | 85.0 /100 | #149 | Excellent 28.6% |
| Northern Europeans | 81.7 /100 | #150 | Excellent 28.6% |
| Immigrants | Oceania | 79.9 /100 | #151 | Good 28.7% |
| Austrians | 79.0 /100 | #152 | Good 28.7% |
| Slovenes | 76.4 /100 | #153 | Good 28.8% |
| Portuguese | 73.2 /100 | #154 | Good 28.8% |
| Ugandans | 71.7 /100 | #155 | Good 28.8% |
| Iraqis | 71.5 /100 | #156 | Good 28.8% |
| Immigrants | Western Europe | 71.1 /100 | #157 | Good 28.9% |
| Immigrants | Hungary | 70.6 /100 | #158 | Good 28.9% |
| Czechs | 68.4 /100 | #159 | Good 28.9% |
| Japanese | 68.0 /100 | #160 | Good 28.9% |