Pueblo vs Immigrants from Vietnam Female Poverty Among 25-34 Year Olds
COMPARE
Pueblo
Immigrants from Vietnam
Female Poverty Among 25-34 Year Olds
Female Poverty Among 25-34 Year Olds Comparison
Pueblo
Immigrants from Vietnam
22.2%
FEMALE POVERTY AMONG 25-34 YEAR OLDS
0.0/ 100
METRIC RATING
336th/ 347
METRIC RANK
12.3%
FEMALE POVERTY AMONG 25-34 YEAR OLDS
98.9/ 100
METRIC RATING
73rd/ 347
METRIC RANK
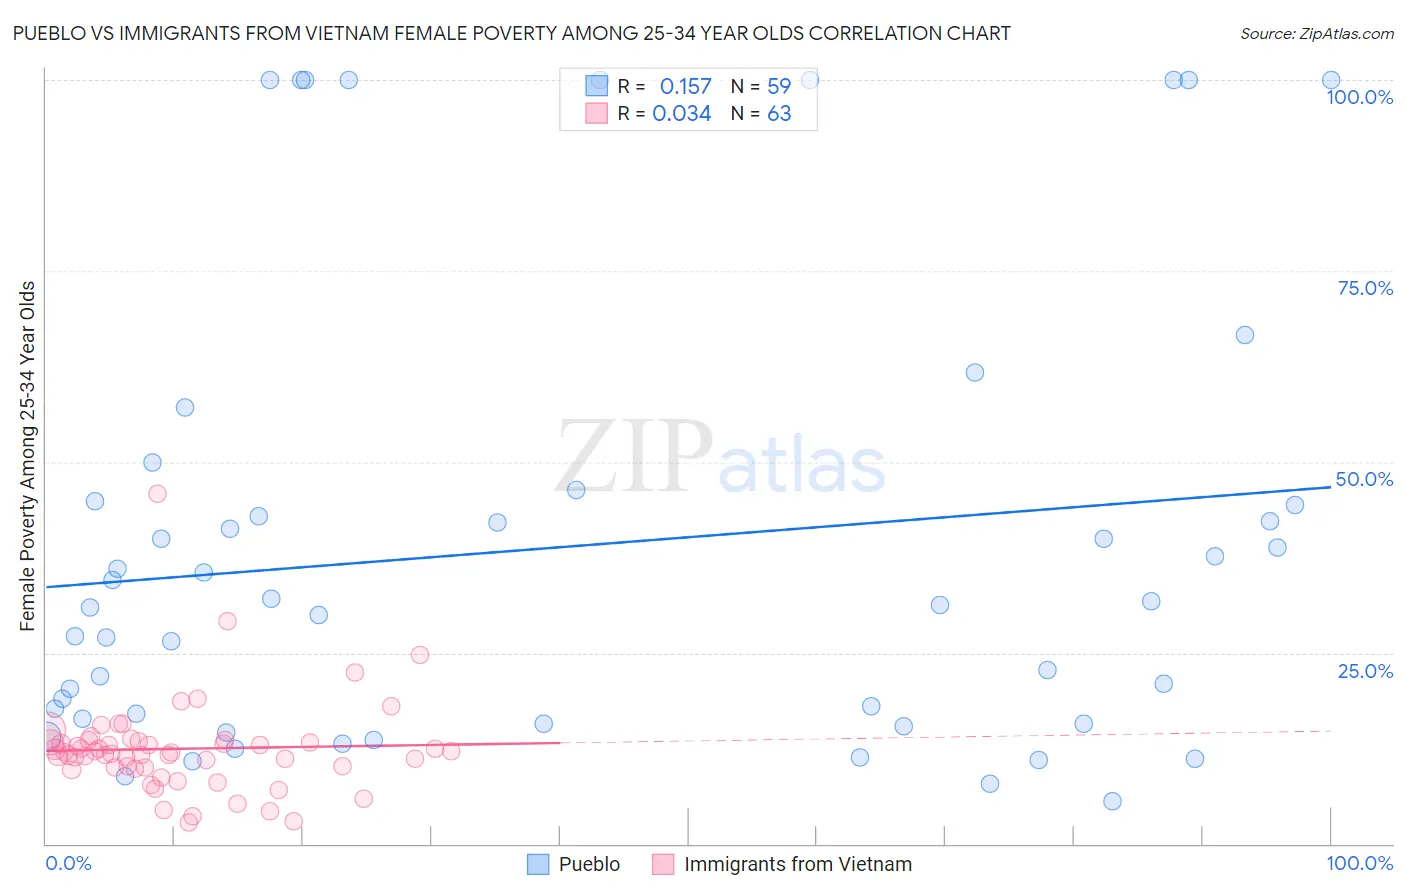
Pueblo vs Immigrants from Vietnam Female Poverty Among 25-34 Year Olds Correlation Chart
The statistical analysis conducted on geographies consisting of 119,661,710 people shows a poor positive correlation between the proportion of Pueblo and poverty level among females between the ages 25 and 34 in the United States with a correlation coefficient (R) of 0.157 and weighted average of 22.2%. Similarly, the statistical analysis conducted on geographies consisting of 399,177,676 people shows no correlation between the proportion of Immigrants from Vietnam and poverty level among females between the ages 25 and 34 in the United States with a correlation coefficient (R) of 0.034 and weighted average of 12.3%, a difference of 80.8%.
Female Poverty Among 25-34 Year Olds Correlation Summary
| Measurement | Pueblo | Immigrants from Vietnam |
| Minimum | 5.6% | 2.7% |
| Maximum | 100.0% | 45.8% |
| Range | 94.4% | 43.1% |
| Mean | 38.9% | 12.4% |
| Median | 31.2% | 11.9% |
| Interquartile 25% (IQ1) | 15.8% | 9.9% |
| Interquartile 75% (IQ3) | 44.9% | 13.4% |
| Interquartile Range (IQR) | 29.1% | 3.5% |
| Standard Deviation (Sample) | 29.6% | 6.3% |
| Standard Deviation (Population) | 29.3% | 6.3% |
Similar Demographics by Female Poverty Among 25-34 Year Olds
Demographics Similar to Pueblo by Female Poverty Among 25-34 Year Olds
In terms of female poverty among 25-34 year olds, the demographic groups most similar to Pueblo are Crow (22.7%, a difference of 2.3%), Houma (22.7%, a difference of 2.5%), Yuman (22.9%, a difference of 3.4%), Sioux (23.0%, a difference of 3.5%), and Navajo (23.3%, a difference of 5.3%).
| Demographics | Rating | Rank | Female Poverty Among 25-34 Year Olds |
| Creek | 0.0 /100 | #329 | Tragic 19.2% |
| Paiute | 0.0 /100 | #330 | Tragic 19.6% |
| Kiowa | 0.0 /100 | #331 | Tragic 19.7% |
| Immigrants | Yemen | 0.0 /100 | #332 | Tragic 19.8% |
| Cajuns | 0.0 /100 | #333 | Tragic 19.9% |
| Apache | 0.0 /100 | #334 | Tragic 20.1% |
| Natives/Alaskans | 0.0 /100 | #335 | Tragic 20.3% |
| Pueblo | 0.0 /100 | #336 | Tragic 22.2% |
| Crow | 0.0 /100 | #337 | Tragic 22.7% |
| Houma | 0.0 /100 | #338 | Tragic 22.7% |
| Yuman | 0.0 /100 | #339 | Tragic 22.9% |
| Sioux | 0.0 /100 | #340 | Tragic 23.0% |
| Navajo | 0.0 /100 | #341 | Tragic 23.3% |
| Hopi | 0.0 /100 | #342 | Tragic 23.7% |
| Yup'ik | 0.0 /100 | #343 | Tragic 24.3% |
Demographics Similar to Immigrants from Vietnam by Female Poverty Among 25-34 Year Olds
In terms of female poverty among 25-34 year olds, the demographic groups most similar to Immigrants from Vietnam are Immigrants from Sweden (12.3%, a difference of 0.030%), Estonian (12.3%, a difference of 0.080%), Greek (12.3%, a difference of 0.14%), Immigrants from Italy (12.3%, a difference of 0.30%), and Lithuanian (12.2%, a difference of 0.31%).
| Demographics | Rating | Rank | Female Poverty Among 25-34 Year Olds |
| Immigrants | Europe | 99.2 /100 | #66 | Exceptional 12.2% |
| Laotians | 99.2 /100 | #67 | Exceptional 12.2% |
| Sri Lankans | 99.1 /100 | #68 | Exceptional 12.2% |
| Immigrants | Lebanon | 99.1 /100 | #69 | Exceptional 12.2% |
| Immigrants | Belgium | 99.1 /100 | #70 | Exceptional 12.2% |
| Immigrants | Scotland | 99.1 /100 | #71 | Exceptional 12.2% |
| Lithuanians | 99.1 /100 | #72 | Exceptional 12.2% |
| Immigrants | Vietnam | 98.9 /100 | #73 | Exceptional 12.3% |
| Immigrants | Sweden | 98.9 /100 | #74 | Exceptional 12.3% |
| Estonians | 98.9 /100 | #75 | Exceptional 12.3% |
| Greeks | 98.9 /100 | #76 | Exceptional 12.3% |
| Immigrants | Italy | 98.8 /100 | #77 | Exceptional 12.3% |
| Immigrants | Ukraine | 98.6 /100 | #78 | Exceptional 12.3% |
| Immigrants | Jordan | 98.5 /100 | #79 | Exceptional 12.4% |
| Immigrants | Malaysia | 98.3 /100 | #80 | Exceptional 12.4% |