Belizean vs Immigrants from Vietnam Female Poverty Among 25-34 Year Olds
COMPARE
Belizean
Immigrants from Vietnam
Female Poverty Among 25-34 Year Olds
Female Poverty Among 25-34 Year Olds Comparison
Belizeans
Immigrants from Vietnam
15.1%
FEMALE POVERTY AMONG 25-34 YEAR OLDS
0.4/ 100
METRIC RATING
252nd/ 347
METRIC RANK
12.3%
FEMALE POVERTY AMONG 25-34 YEAR OLDS
98.9/ 100
METRIC RATING
73rd/ 347
METRIC RANK
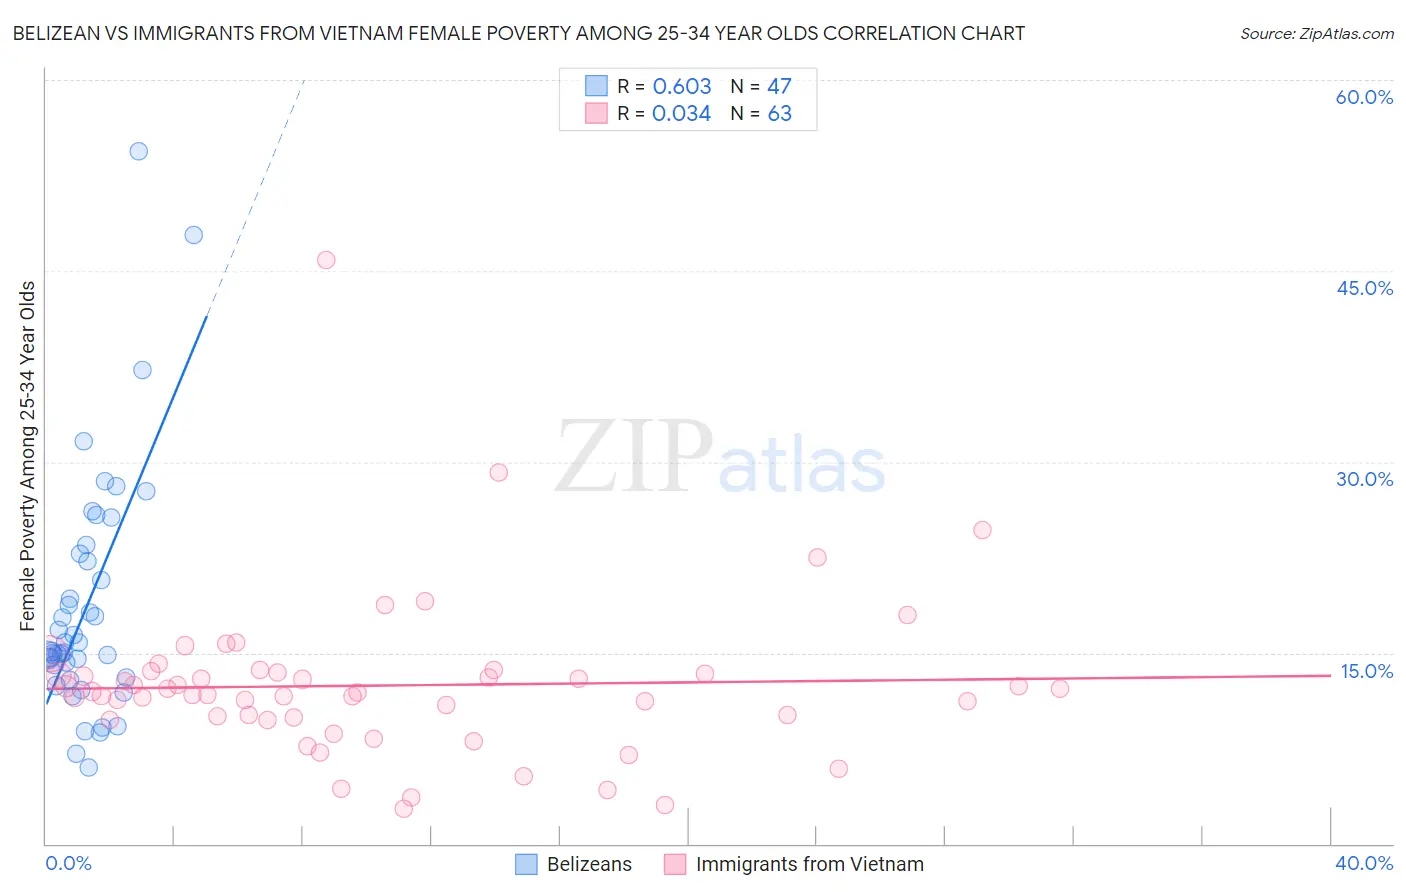
Belizean vs Immigrants from Vietnam Female Poverty Among 25-34 Year Olds Correlation Chart
The statistical analysis conducted on geographies consisting of 143,799,861 people shows a significant positive correlation between the proportion of Belizeans and poverty level among females between the ages 25 and 34 in the United States with a correlation coefficient (R) of 0.603 and weighted average of 15.1%. Similarly, the statistical analysis conducted on geographies consisting of 399,177,676 people shows no correlation between the proportion of Immigrants from Vietnam and poverty level among females between the ages 25 and 34 in the United States with a correlation coefficient (R) of 0.034 and weighted average of 12.3%, a difference of 22.8%.
Female Poverty Among 25-34 Year Olds Correlation Summary
| Measurement | Belizean | Immigrants from Vietnam |
| Minimum | 6.0% | 2.7% |
| Maximum | 54.4% | 45.8% |
| Range | 48.4% | 43.1% |
| Mean | 18.7% | 12.4% |
| Median | 15.1% | 11.9% |
| Interquartile 25% (IQ1) | 13.0% | 9.9% |
| Interquartile 75% (IQ3) | 22.8% | 13.4% |
| Interquartile Range (IQR) | 9.8% | 3.5% |
| Standard Deviation (Sample) | 9.6% | 6.3% |
| Standard Deviation (Population) | 9.5% | 6.3% |
Similar Demographics by Female Poverty Among 25-34 Year Olds
Demographics Similar to Belizeans by Female Poverty Among 25-34 Year Olds
In terms of female poverty among 25-34 year olds, the demographic groups most similar to Belizeans are Immigrants from West Indies (15.1%, a difference of 0.14%), Haitian (15.0%, a difference of 0.17%), Somali (15.1%, a difference of 0.22%), Immigrants from El Salvador (15.0%, a difference of 0.36%), and Immigrants from Haiti (15.0%, a difference of 0.39%).
| Demographics | Rating | Rank | Female Poverty Among 25-34 Year Olds |
| Immigrants | Middle Africa | 1.0 /100 | #245 | Tragic 14.8% |
| Jamaicans | 1.0 /100 | #246 | Tragic 14.8% |
| German Russians | 0.8 /100 | #247 | Tragic 14.9% |
| Immigrants | Western Africa | 0.8 /100 | #248 | Tragic 14.9% |
| Immigrants | Haiti | 0.5 /100 | #249 | Tragic 15.0% |
| Immigrants | El Salvador | 0.5 /100 | #250 | Tragic 15.0% |
| Haitians | 0.5 /100 | #251 | Tragic 15.0% |
| Belizeans | 0.4 /100 | #252 | Tragic 15.1% |
| Immigrants | West Indies | 0.4 /100 | #253 | Tragic 15.1% |
| Somalis | 0.4 /100 | #254 | Tragic 15.1% |
| Immigrants | Laos | 0.3 /100 | #255 | Tragic 15.2% |
| West Indians | 0.3 /100 | #256 | Tragic 15.2% |
| Immigrants | Burma/Myanmar | 0.3 /100 | #257 | Tragic 15.2% |
| Nepalese | 0.2 /100 | #258 | Tragic 15.2% |
| Immigrants | Cuba | 0.2 /100 | #259 | Tragic 15.2% |
Demographics Similar to Immigrants from Vietnam by Female Poverty Among 25-34 Year Olds
In terms of female poverty among 25-34 year olds, the demographic groups most similar to Immigrants from Vietnam are Immigrants from Sweden (12.3%, a difference of 0.030%), Estonian (12.3%, a difference of 0.080%), Greek (12.3%, a difference of 0.14%), Immigrants from Italy (12.3%, a difference of 0.30%), and Lithuanian (12.2%, a difference of 0.31%).
| Demographics | Rating | Rank | Female Poverty Among 25-34 Year Olds |
| Immigrants | Europe | 99.2 /100 | #66 | Exceptional 12.2% |
| Laotians | 99.2 /100 | #67 | Exceptional 12.2% |
| Sri Lankans | 99.1 /100 | #68 | Exceptional 12.2% |
| Immigrants | Lebanon | 99.1 /100 | #69 | Exceptional 12.2% |
| Immigrants | Belgium | 99.1 /100 | #70 | Exceptional 12.2% |
| Immigrants | Scotland | 99.1 /100 | #71 | Exceptional 12.2% |
| Lithuanians | 99.1 /100 | #72 | Exceptional 12.2% |
| Immigrants | Vietnam | 98.9 /100 | #73 | Exceptional 12.3% |
| Immigrants | Sweden | 98.9 /100 | #74 | Exceptional 12.3% |
| Estonians | 98.9 /100 | #75 | Exceptional 12.3% |
| Greeks | 98.9 /100 | #76 | Exceptional 12.3% |
| Immigrants | Italy | 98.8 /100 | #77 | Exceptional 12.3% |
| Immigrants | Ukraine | 98.6 /100 | #78 | Exceptional 12.3% |
| Immigrants | Jordan | 98.5 /100 | #79 | Exceptional 12.4% |
| Immigrants | Malaysia | 98.3 /100 | #80 | Exceptional 12.4% |