Pueblo vs Immigrants from Nicaragua Family Poverty
COMPARE
Pueblo
Immigrants from Nicaragua
Family Poverty
Family Poverty Comparison
Pueblo
Immigrants from Nicaragua
17.0%
FAMILY POVERTY
0.0/ 100
METRIC RATING
340th/ 347
METRIC RANK
11.1%
FAMILY POVERTY
0.1/ 100
METRIC RATING
270th/ 347
METRIC RANK
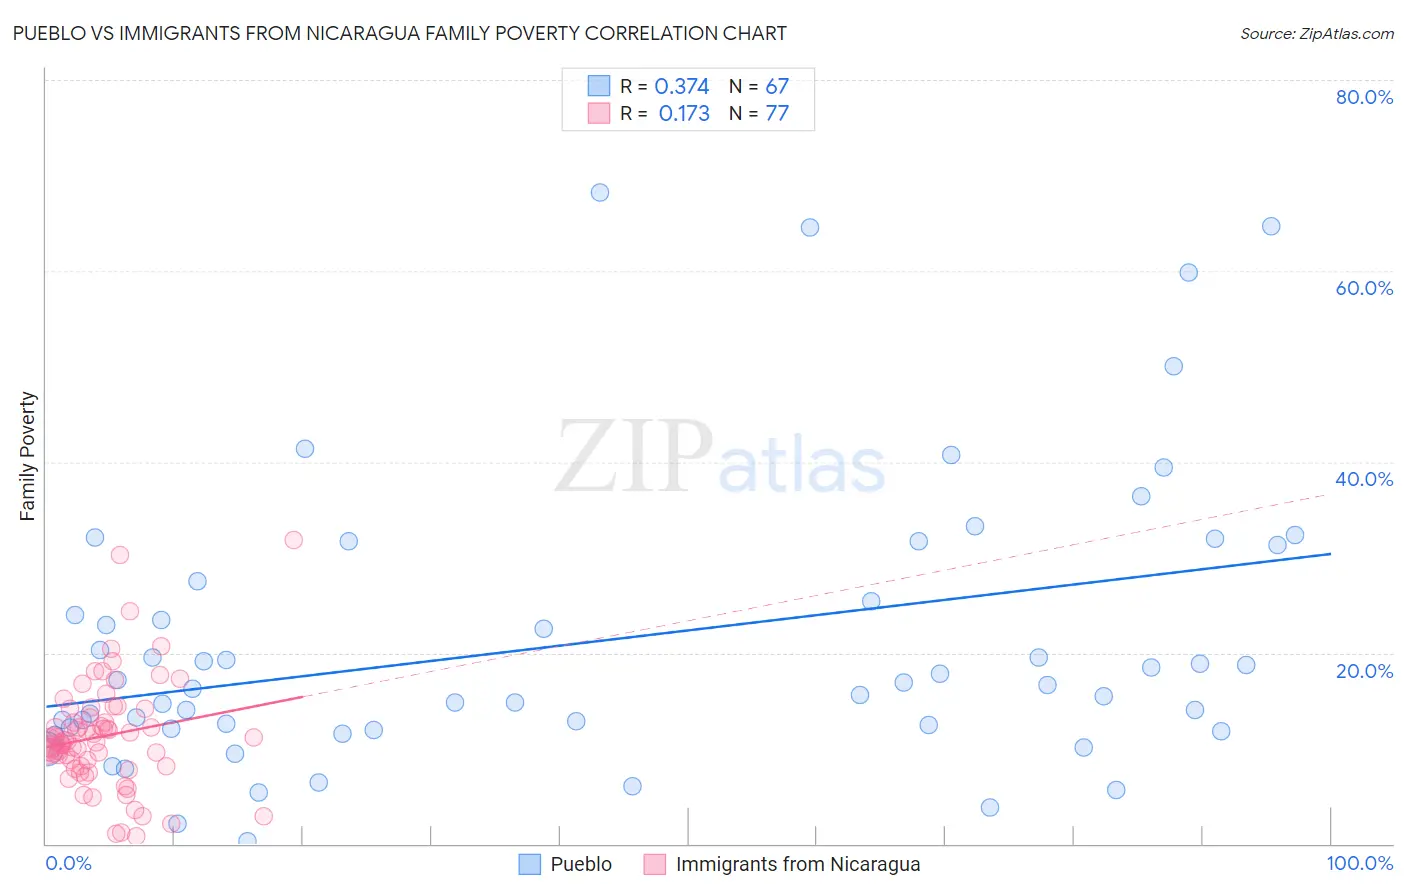
Pueblo vs Immigrants from Nicaragua Family Poverty Correlation Chart
The statistical analysis conducted on geographies consisting of 120,003,274 people shows a mild positive correlation between the proportion of Pueblo and poverty level among families in the United States with a correlation coefficient (R) of 0.374 and weighted average of 17.0%. Similarly, the statistical analysis conducted on geographies consisting of 236,234,574 people shows a poor positive correlation between the proportion of Immigrants from Nicaragua and poverty level among families in the United States with a correlation coefficient (R) of 0.173 and weighted average of 11.1%, a difference of 52.8%.
Family Poverty Correlation Summary
| Measurement | Pueblo | Immigrants from Nicaragua |
| Minimum | 0.20% | 0.77% |
| Maximum | 68.2% | 31.8% |
| Range | 68.0% | 31.0% |
| Mean | 21.1% | 11.3% |
| Median | 16.7% | 10.6% |
| Interquartile 25% (IQ1) | 12.0% | 8.2% |
| Interquartile 75% (IQ3) | 27.5% | 13.7% |
| Interquartile Range (IQR) | 15.5% | 5.5% |
| Standard Deviation (Sample) | 15.0% | 5.7% |
| Standard Deviation (Population) | 14.8% | 5.6% |
Similar Demographics by Family Poverty
Demographics Similar to Pueblo by Family Poverty
In terms of family poverty, the demographic groups most similar to Pueblo are Lumbee (17.0%, a difference of 0.070%), Yuman (16.6%, a difference of 2.1%), Immigrants from Yemen (17.5%, a difference of 2.8%), Crow (16.1%, a difference of 5.4%), and Hopi (15.9%, a difference of 6.6%).
| Demographics | Rating | Rank | Family Poverty |
| Immigrants | Dominican Republic | 0.0 /100 | #333 | Tragic 14.4% |
| Houma | 0.0 /100 | #334 | Tragic 14.6% |
| Apache | 0.0 /100 | #335 | Tragic 14.7% |
| Sioux | 0.0 /100 | #336 | Tragic 15.9% |
| Hopi | 0.0 /100 | #337 | Tragic 15.9% |
| Crow | 0.0 /100 | #338 | Tragic 16.1% |
| Yuman | 0.0 /100 | #339 | Tragic 16.6% |
| Pueblo | 0.0 /100 | #340 | Tragic 17.0% |
| Lumbee | 0.0 /100 | #341 | Tragic 17.0% |
| Immigrants | Yemen | 0.0 /100 | #342 | Tragic 17.5% |
| Pima | 0.0 /100 | #343 | Tragic 18.4% |
| Yup'ik | 0.0 /100 | #344 | Tragic 18.7% |
| Navajo | 0.0 /100 | #345 | Tragic 18.8% |
| Puerto Ricans | 0.0 /100 | #346 | Tragic 20.3% |
| Tohono O'odham | 0.0 /100 | #347 | Tragic 20.4% |
Demographics Similar to Immigrants from Nicaragua by Family Poverty
In terms of family poverty, the demographic groups most similar to Immigrants from Nicaragua are Immigrants from Ecuador (11.1%, a difference of 0.010%), Immigrants from Bahamas (11.1%, a difference of 0.25%), Immigrants from Jamaica (11.2%, a difference of 0.34%), Jamaican (11.1%, a difference of 0.49%), and Comanche (11.0%, a difference of 0.59%).
| Demographics | Rating | Rank | Family Poverty |
| Cape Verdeans | 0.1 /100 | #263 | Tragic 10.9% |
| Trinidadians and Tobagonians | 0.1 /100 | #264 | Tragic 10.9% |
| Immigrants | Trinidad and Tobago | 0.1 /100 | #265 | Tragic 10.9% |
| Immigrants | El Salvador | 0.1 /100 | #266 | Tragic 11.0% |
| Comanche | 0.1 /100 | #267 | Tragic 11.0% |
| Jamaicans | 0.1 /100 | #268 | Tragic 11.1% |
| Immigrants | Ecuador | 0.1 /100 | #269 | Tragic 11.1% |
| Immigrants | Nicaragua | 0.1 /100 | #270 | Tragic 11.1% |
| Immigrants | Bahamas | 0.1 /100 | #271 | Tragic 11.1% |
| Immigrants | Jamaica | 0.1 /100 | #272 | Tragic 11.2% |
| Somalis | 0.1 /100 | #273 | Tragic 11.2% |
| Spanish Americans | 0.1 /100 | #274 | Tragic 11.2% |
| Central Americans | 0.1 /100 | #275 | Tragic 11.2% |
| Immigrants | Guyana | 0.1 /100 | #276 | Tragic 11.2% |
| Chippewa | 0.1 /100 | #277 | Tragic 11.2% |