Belgian vs Immigrants from Nicaragua Family Poverty
COMPARE
Belgian
Immigrants from Nicaragua
Family Poverty
Family Poverty Comparison
Belgians
Immigrants from Nicaragua
8.0%
FAMILY POVERTY
97.3/ 100
METRIC RATING
87th/ 347
METRIC RANK
11.1%
FAMILY POVERTY
0.1/ 100
METRIC RATING
270th/ 347
METRIC RANK
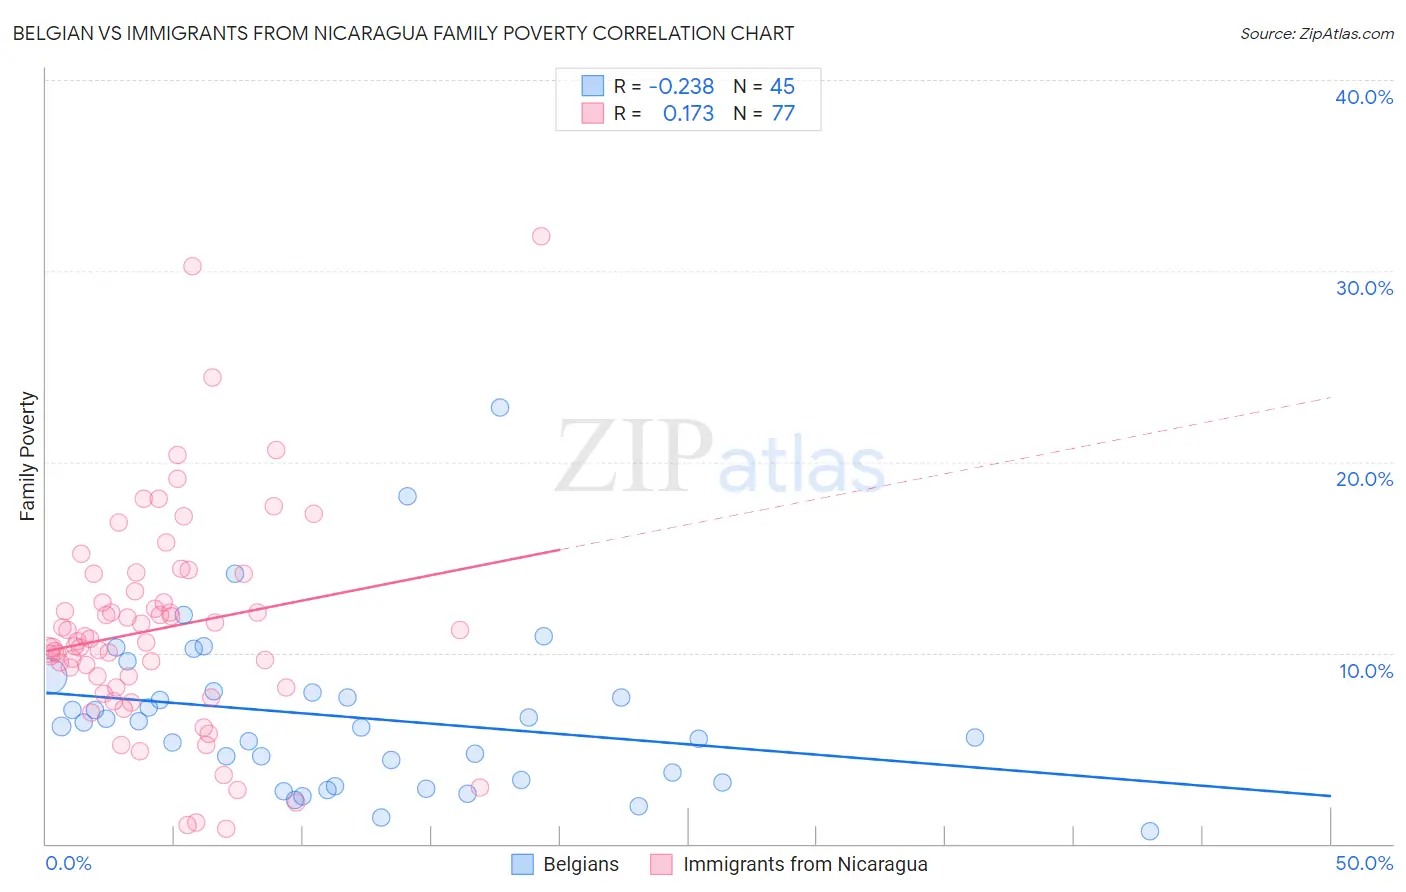
Belgian vs Immigrants from Nicaragua Family Poverty Correlation Chart
The statistical analysis conducted on geographies consisting of 355,051,863 people shows a weak negative correlation between the proportion of Belgians and poverty level among families in the United States with a correlation coefficient (R) of -0.238 and weighted average of 8.0%. Similarly, the statistical analysis conducted on geographies consisting of 236,234,574 people shows a poor positive correlation between the proportion of Immigrants from Nicaragua and poverty level among families in the United States with a correlation coefficient (R) of 0.173 and weighted average of 11.1%, a difference of 39.8%.
Family Poverty Correlation Summary
| Measurement | Belgian | Immigrants from Nicaragua |
| Minimum | 0.68% | 0.77% |
| Maximum | 22.9% | 31.8% |
| Range | 22.2% | 31.0% |
| Mean | 6.6% | 11.3% |
| Median | 6.2% | 10.6% |
| Interquartile 25% (IQ1) | 3.3% | 8.2% |
| Interquartile 75% (IQ3) | 8.0% | 13.7% |
| Interquartile Range (IQR) | 4.7% | 5.5% |
| Standard Deviation (Sample) | 4.3% | 5.7% |
| Standard Deviation (Population) | 4.2% | 5.6% |
Similar Demographics by Family Poverty
Demographics Similar to Belgians by Family Poverty
In terms of family poverty, the demographic groups most similar to Belgians are Serbian (8.0%, a difference of 0.070%), Scottish (7.9%, a difference of 0.090%), Immigrants from Asia (7.9%, a difference of 0.13%), Immigrants from Denmark (8.0%, a difference of 0.21%), and Immigrants from England (8.0%, a difference of 0.21%).
| Demographics | Rating | Rank | Family Poverty |
| English | 97.8 /100 | #80 | Exceptional 7.9% |
| Irish | 97.8 /100 | #81 | Exceptional 7.9% |
| Immigrants | Poland | 97.8 /100 | #82 | Exceptional 7.9% |
| Slovaks | 97.7 /100 | #83 | Exceptional 7.9% |
| British | 97.5 /100 | #84 | Exceptional 7.9% |
| Immigrants | Asia | 97.4 /100 | #85 | Exceptional 7.9% |
| Scottish | 97.3 /100 | #86 | Exceptional 7.9% |
| Belgians | 97.3 /100 | #87 | Exceptional 8.0% |
| Serbians | 97.2 /100 | #88 | Exceptional 8.0% |
| Immigrants | Denmark | 97.1 /100 | #89 | Exceptional 8.0% |
| Immigrants | England | 97.1 /100 | #90 | Exceptional 8.0% |
| Immigrants | Italy | 97.0 /100 | #91 | Exceptional 8.0% |
| Czechoslovakians | 96.8 /100 | #92 | Exceptional 8.0% |
| Tlingit-Haida | 96.7 /100 | #93 | Exceptional 8.0% |
| Immigrants | Pakistan | 96.6 /100 | #94 | Exceptional 8.0% |
Demographics Similar to Immigrants from Nicaragua by Family Poverty
In terms of family poverty, the demographic groups most similar to Immigrants from Nicaragua are Immigrants from Ecuador (11.1%, a difference of 0.010%), Immigrants from Bahamas (11.1%, a difference of 0.25%), Immigrants from Jamaica (11.2%, a difference of 0.34%), Jamaican (11.1%, a difference of 0.49%), and Comanche (11.0%, a difference of 0.59%).
| Demographics | Rating | Rank | Family Poverty |
| Cape Verdeans | 0.1 /100 | #263 | Tragic 10.9% |
| Trinidadians and Tobagonians | 0.1 /100 | #264 | Tragic 10.9% |
| Immigrants | Trinidad and Tobago | 0.1 /100 | #265 | Tragic 10.9% |
| Immigrants | El Salvador | 0.1 /100 | #266 | Tragic 11.0% |
| Comanche | 0.1 /100 | #267 | Tragic 11.0% |
| Jamaicans | 0.1 /100 | #268 | Tragic 11.1% |
| Immigrants | Ecuador | 0.1 /100 | #269 | Tragic 11.1% |
| Immigrants | Nicaragua | 0.1 /100 | #270 | Tragic 11.1% |
| Immigrants | Bahamas | 0.1 /100 | #271 | Tragic 11.1% |
| Immigrants | Jamaica | 0.1 /100 | #272 | Tragic 11.2% |
| Somalis | 0.1 /100 | #273 | Tragic 11.2% |
| Spanish Americans | 0.1 /100 | #274 | Tragic 11.2% |
| Central Americans | 0.1 /100 | #275 | Tragic 11.2% |
| Immigrants | Guyana | 0.1 /100 | #276 | Tragic 11.2% |
| Chippewa | 0.1 /100 | #277 | Tragic 11.2% |