Pueblo vs Immigrants from Albania Single Female Poverty
COMPARE
Pueblo
Immigrants from Albania
Single Female Poverty
Single Female Poverty Comparison
Pueblo
Immigrants from Albania
28.6%
SINGLE FEMALE POVERTY
0.0/ 100
METRIC RATING
334th/ 347
METRIC RANK
19.4%
SINGLE FEMALE POVERTY
99.2/ 100
METRIC RATING
85th/ 347
METRIC RANK
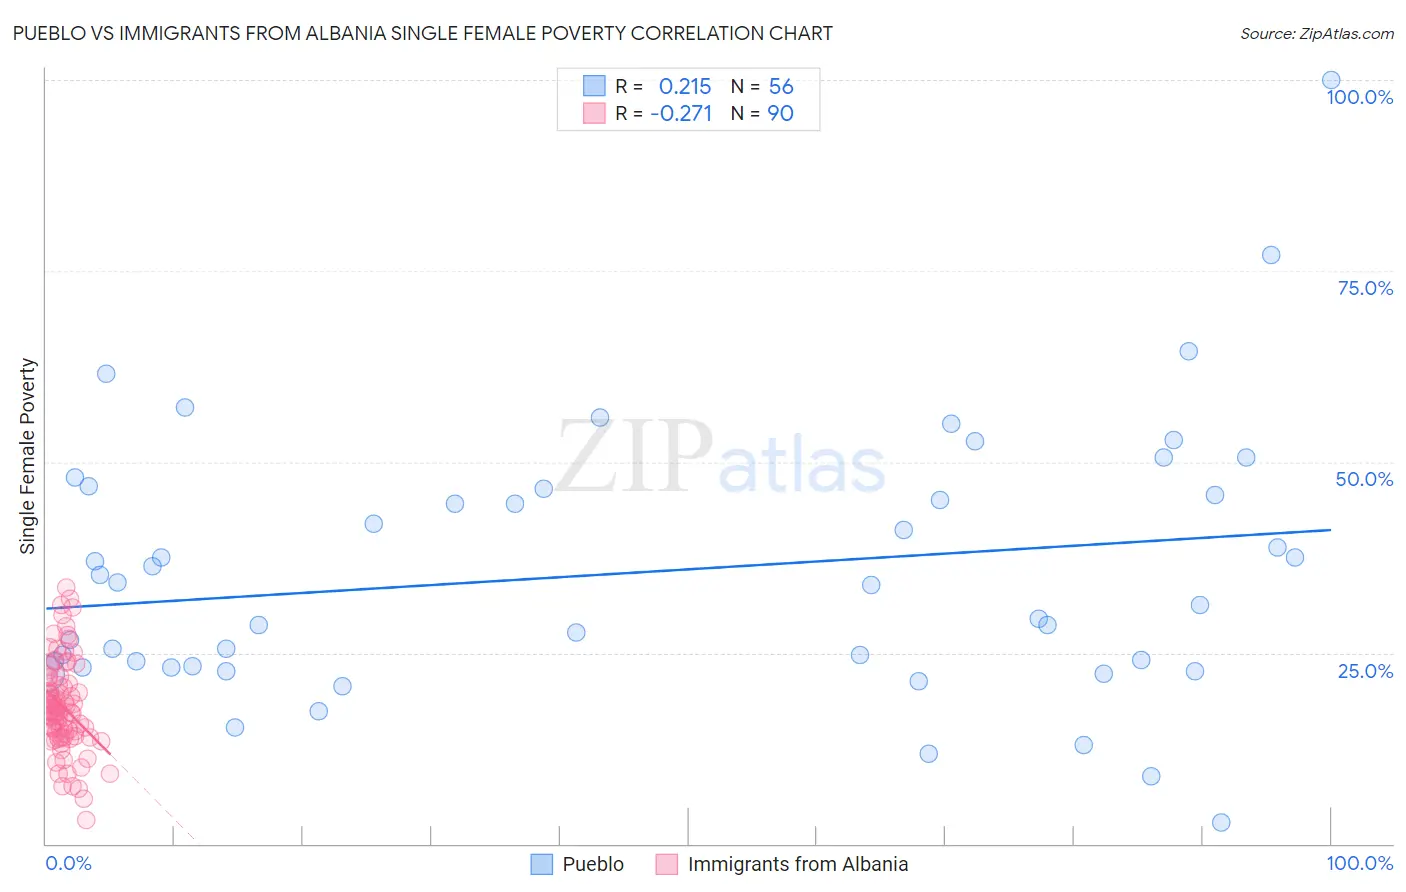
Pueblo vs Immigrants from Albania Single Female Poverty Correlation Chart
The statistical analysis conducted on geographies consisting of 119,546,041 people shows a weak positive correlation between the proportion of Pueblo and poverty level among single females in the United States with a correlation coefficient (R) of 0.215 and weighted average of 28.6%. Similarly, the statistical analysis conducted on geographies consisting of 118,461,205 people shows a weak negative correlation between the proportion of Immigrants from Albania and poverty level among single females in the United States with a correlation coefficient (R) of -0.271 and weighted average of 19.4%, a difference of 47.2%.
Single Female Poverty Correlation Summary
| Measurement | Pueblo | Immigrants from Albania |
| Minimum | 2.9% | 3.1% |
| Maximum | 100.0% | 33.6% |
| Range | 97.1% | 30.4% |
| Mean | 35.5% | 17.9% |
| Median | 32.6% | 17.2% |
| Interquartile 25% (IQ1) | 23.2% | 14.0% |
| Interquartile 75% (IQ3) | 46.1% | 20.9% |
| Interquartile Range (IQR) | 22.9% | 6.9% |
| Standard Deviation (Sample) | 17.5% | 6.1% |
| Standard Deviation (Population) | 17.4% | 6.0% |
Similar Demographics by Single Female Poverty
Demographics Similar to Pueblo by Single Female Poverty
In terms of single female poverty, the demographic groups most similar to Pueblo are Ute (28.4%, a difference of 0.73%), Immigrants from Yemen (28.9%, a difference of 1.1%), Yakama (28.3%, a difference of 1.1%), Native/Alaskan (28.2%, a difference of 1.4%), and Colville (29.1%, a difference of 1.6%).
| Demographics | Rating | Rank | Single Female Poverty |
| Dutch West Indians | 0.0 /100 | #327 | Tragic 27.5% |
| Apache | 0.0 /100 | #328 | Tragic 27.7% |
| Menominee | 0.0 /100 | #329 | Tragic 27.8% |
| Hopi | 0.0 /100 | #330 | Tragic 28.0% |
| Natives/Alaskans | 0.0 /100 | #331 | Tragic 28.2% |
| Yakama | 0.0 /100 | #332 | Tragic 28.3% |
| Ute | 0.0 /100 | #333 | Tragic 28.4% |
| Pueblo | 0.0 /100 | #334 | Tragic 28.6% |
| Immigrants | Yemen | 0.0 /100 | #335 | Tragic 28.9% |
| Colville | 0.0 /100 | #336 | Tragic 29.1% |
| Yuman | 0.0 /100 | #337 | Tragic 29.4% |
| Pima | 0.0 /100 | #338 | Tragic 30.3% |
| Cheyenne | 0.0 /100 | #339 | Tragic 30.4% |
| Cajuns | 0.0 /100 | #340 | Tragic 30.6% |
| Sioux | 0.0 /100 | #341 | Tragic 31.3% |
Demographics Similar to Immigrants from Albania by Single Female Poverty
In terms of single female poverty, the demographic groups most similar to Immigrants from Albania are Greek (19.4%, a difference of 0.0%), Immigrants from Sweden (19.4%, a difference of 0.040%), Taiwanese (19.4%, a difference of 0.12%), Immigrants from Malaysia (19.4%, a difference of 0.13%), and Immigrants from Scotland (19.4%, a difference of 0.14%).
| Demographics | Rating | Rank | Single Female Poverty |
| Albanians | 99.3 /100 | #78 | Exceptional 19.4% |
| Immigrants | Sierra Leone | 99.3 /100 | #79 | Exceptional 19.4% |
| Immigrants | Australia | 99.3 /100 | #80 | Exceptional 19.4% |
| Immigrants | Scotland | 99.2 /100 | #81 | Exceptional 19.4% |
| Immigrants | Malaysia | 99.2 /100 | #82 | Exceptional 19.4% |
| Taiwanese | 99.2 /100 | #83 | Exceptional 19.4% |
| Immigrants | Sweden | 99.2 /100 | #84 | Exceptional 19.4% |
| Immigrants | Albania | 99.2 /100 | #85 | Exceptional 19.4% |
| Greeks | 99.2 /100 | #86 | Exceptional 19.4% |
| Zimbabweans | 99.0 /100 | #87 | Exceptional 19.5% |
| Afghans | 99.0 /100 | #88 | Exceptional 19.5% |
| Immigrants | Ukraine | 99.0 /100 | #89 | Exceptional 19.5% |
| Immigrants | Lebanon | 98.8 /100 | #90 | Exceptional 19.6% |
| Soviet Union | 98.8 /100 | #91 | Exceptional 19.6% |
| Italians | 98.8 /100 | #92 | Exceptional 19.6% |