Immigrants from Europe vs Immigrants from Albania Single Female Poverty
COMPARE
Immigrants from Europe
Immigrants from Albania
Single Female Poverty
Single Female Poverty Comparison
Immigrants from Europe
Immigrants from Albania
19.2%
SINGLE FEMALE POVERTY
99.6/ 100
METRIC RATING
64th/ 347
METRIC RANK
19.4%
SINGLE FEMALE POVERTY
99.2/ 100
METRIC RATING
85th/ 347
METRIC RANK
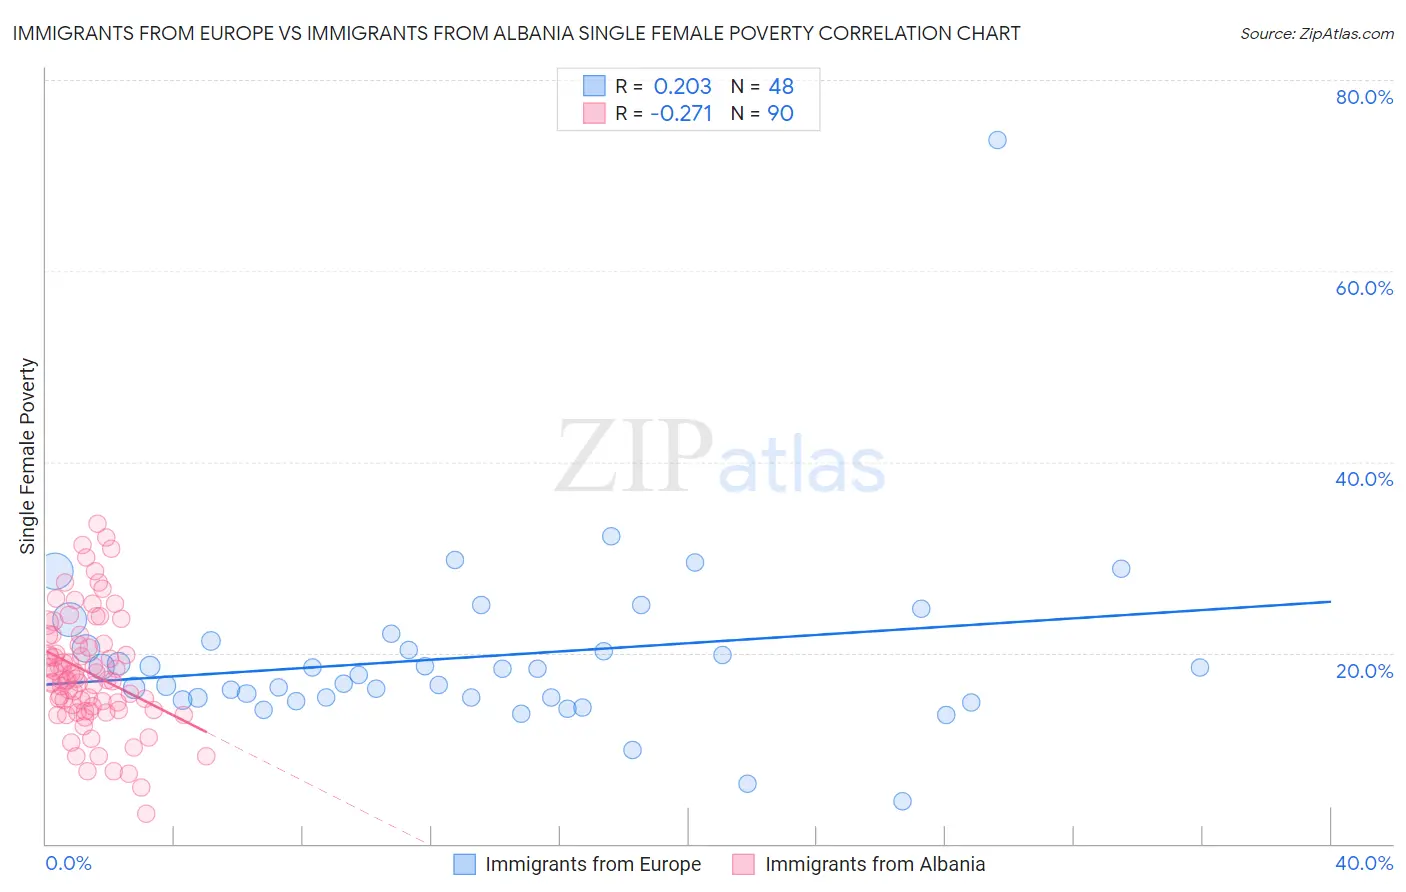
Immigrants from Europe vs Immigrants from Albania Single Female Poverty Correlation Chart
The statistical analysis conducted on geographies consisting of 530,423,700 people shows a weak positive correlation between the proportion of Immigrants from Europe and poverty level among single females in the United States with a correlation coefficient (R) of 0.203 and weighted average of 19.2%. Similarly, the statistical analysis conducted on geographies consisting of 118,461,205 people shows a weak negative correlation between the proportion of Immigrants from Albania and poverty level among single females in the United States with a correlation coefficient (R) of -0.271 and weighted average of 19.4%, a difference of 1.1%.
Single Female Poverty Correlation Summary
| Measurement | Immigrants from Europe | Immigrants from Albania |
| Minimum | 4.4% | 3.1% |
| Maximum | 73.7% | 33.6% |
| Range | 69.3% | 30.4% |
| Mean | 19.5% | 17.9% |
| Median | 18.0% | 17.2% |
| Interquartile 25% (IQ1) | 15.3% | 14.0% |
| Interquartile 75% (IQ3) | 20.8% | 20.9% |
| Interquartile Range (IQR) | 5.6% | 6.9% |
| Standard Deviation (Sample) | 9.7% | 6.1% |
| Standard Deviation (Population) | 9.6% | 6.0% |
Similar Demographics by Single Female Poverty
Demographics Similar to Immigrants from Europe by Single Female Poverty
In terms of single female poverty, the demographic groups most similar to Immigrants from Europe are Immigrants from Northern Europe (19.2%, a difference of 0.0%), Cypriot (19.2%, a difference of 0.030%), Palestinian (19.2%, a difference of 0.040%), Immigrants from Egypt (19.2%, a difference of 0.080%), and Laotian (19.3%, a difference of 0.12%).
| Demographics | Rating | Rank | Single Female Poverty |
| Eastern Europeans | 99.7 /100 | #57 | Exceptional 19.1% |
| Immigrants | Bulgaria | 99.7 /100 | #58 | Exceptional 19.1% |
| Sri Lankans | 99.6 /100 | #59 | Exceptional 19.2% |
| Russians | 99.6 /100 | #60 | Exceptional 19.2% |
| Cambodians | 99.6 /100 | #61 | Exceptional 19.2% |
| Lithuanians | 99.6 /100 | #62 | Exceptional 19.2% |
| Immigrants | Northern Europe | 99.6 /100 | #63 | Exceptional 19.2% |
| Immigrants | Europe | 99.6 /100 | #64 | Exceptional 19.2% |
| Cypriots | 99.6 /100 | #65 | Exceptional 19.2% |
| Palestinians | 99.6 /100 | #66 | Exceptional 19.2% |
| Immigrants | Egypt | 99.6 /100 | #67 | Exceptional 19.2% |
| Laotians | 99.5 /100 | #68 | Exceptional 19.3% |
| Paraguayans | 99.5 /100 | #69 | Exceptional 19.3% |
| Immigrants | Jordan | 99.4 /100 | #70 | Exceptional 19.3% |
| Immigrants | South Eastern Asia | 99.4 /100 | #71 | Exceptional 19.3% |
Demographics Similar to Immigrants from Albania by Single Female Poverty
In terms of single female poverty, the demographic groups most similar to Immigrants from Albania are Greek (19.4%, a difference of 0.0%), Immigrants from Sweden (19.4%, a difference of 0.040%), Taiwanese (19.4%, a difference of 0.12%), Immigrants from Malaysia (19.4%, a difference of 0.13%), and Immigrants from Scotland (19.4%, a difference of 0.14%).
| Demographics | Rating | Rank | Single Female Poverty |
| Albanians | 99.3 /100 | #78 | Exceptional 19.4% |
| Immigrants | Sierra Leone | 99.3 /100 | #79 | Exceptional 19.4% |
| Immigrants | Australia | 99.3 /100 | #80 | Exceptional 19.4% |
| Immigrants | Scotland | 99.2 /100 | #81 | Exceptional 19.4% |
| Immigrants | Malaysia | 99.2 /100 | #82 | Exceptional 19.4% |
| Taiwanese | 99.2 /100 | #83 | Exceptional 19.4% |
| Immigrants | Sweden | 99.2 /100 | #84 | Exceptional 19.4% |
| Immigrants | Albania | 99.2 /100 | #85 | Exceptional 19.4% |
| Greeks | 99.2 /100 | #86 | Exceptional 19.4% |
| Zimbabweans | 99.0 /100 | #87 | Exceptional 19.5% |
| Afghans | 99.0 /100 | #88 | Exceptional 19.5% |
| Immigrants | Ukraine | 99.0 /100 | #89 | Exceptional 19.5% |
| Immigrants | Lebanon | 98.8 /100 | #90 | Exceptional 19.6% |
| Soviet Union | 98.8 /100 | #91 | Exceptional 19.6% |
| Italians | 98.8 /100 | #92 | Exceptional 19.6% |